EstuaryWatch Data Portal
S1 Boardwalk near estuary mouth
Site details
Overview
| Estuary | Spring Creek Estuary |
|---|---|
| CMA | Corangamite CMA |
| Type | Physico-Chemical |
| Site code | S1 |
| Site name | Boardwalk near estuary mouth |
| Nearest road and town | Torquay |
| Description | Boardwalk near estuary mouth |
| Site access | Easily accessed from carpark beside estuary. |
| Land use |
|
| Land use description | Road |
| Status | Active |
| Observation history | 24-06-2007 - 19-12-2023 |
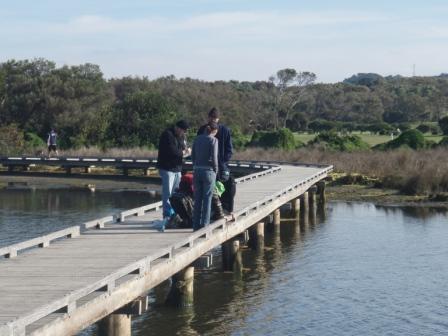
Photo of phys/chem monitoring site S1 |
|
Observations
Turbidity tubes do not measure below 9 NTU; Chart values of 9 should be interpreted as < 9 NTU
Observations
| Date | 30-04-2023 | 27-05-2023 | 12-09-2023 | 02-10-2023 | 16-11-2023 | 19-12-2023 |
|---|---|---|---|---|---|---|
| Observation | #15510 | #15559 | #15825 | #15773 | #15900 | #15921 |
Observation summaries
Turbidity NTU
| 30-04-2023 | 27-05-2023 | 12-09-2023 | 02-10-2023 | 16-11-2023 | 19-12-2023 | |
|---|---|---|---|---|---|---|
| Top | 9.0 | 9.0 | 9.0 | 9.0 | 9.0 | 9.0 |
| Bottom | 9.0 | 9.0 | 9.0 | 9.0 | 9.0 | 9.0 |
pH
| 30-04-2023 | 27-05-2023 | 12-09-2023 | 02-10-2023 | 16-11-2023 | 19-12-2023 | |
|---|---|---|---|---|---|---|
| Top | 7.8 | 7.6 | 8.1 | 7.5 | 7.5 | 7.8 |
| Bottom | 8.0 | 7.9 | 8.1 | 7.8 | 7.9 | 7.7 |
Ammonia mg/L
| 30-04-2023 | 27-05-2023 | 12-09-2023 | 02-10-2023 | 16-11-2023 | 19-12-2023 | |
|---|---|---|---|---|---|---|
| Top | ||||||
| Bottom |
Enterococci orgs/100mL
| 30-04-2023 | 27-05-2023 | 12-09-2023 | 02-10-2023 | 16-11-2023 | 19-12-2023 | |
|---|---|---|---|---|---|---|
| Top | ||||||
| Bottom |
Temperature ° C
| 30-04-2023 | 27-05-2023 | 12-09-2023 | 02-10-2023 | 16-11-2023 | 19-12-2023 | |
|---|---|---|---|---|---|---|
| Top | 19.40 | 13.00 | 16.10 | 19.70 | 18.70 | 19.70 |
| Bottom | 14.80 | 12.40 | 15.90 | 16.40 | 18.60 | 20.10 |
Salinity ppt
| 30-04-2023 | 27-05-2023 | 12-09-2023 | 02-10-2023 | 16-11-2023 | 19-12-2023 | |
|---|---|---|---|---|---|---|
| Top | 31.80 | 15.90 | 15.90 | |||
| Bottom | 37.30 | 17.70 | 16.10 |
D.O. mg/L
| 30-04-2023 | 27-05-2023 | 12-09-2023 | 02-10-2023 | 16-11-2023 | 19-12-2023 | |
|---|---|---|---|---|---|---|
| Top | 7.37 | 10.78 | 9.63 | 7.71 | 7.47 | 7.92 |
| Bottom | 8.18 | 7.19 | 9.66 | 8.46 | 7.52 | 3.23 |
D.O. % Sat
| 30-04-2023 | 27-05-2023 | 12-09-2023 | 02-10-2023 | 16-11-2023 | 19-12-2023 | |
|---|---|---|---|---|---|---|
| Top | 80.20 | 102.80 | 107.10 | 84.60 | 80.30 | 86.80 |
| Bottom | 80.90 | 67.60 | 107.20 | 86.90 | 80.60 | 35.60 |
Conductivity mS/cm
| 30-04-2023 | 27-05-2023 | 12-09-2023 | 02-10-2023 | 16-11-2023 | 19-12-2023 | |
|---|---|---|---|---|---|---|
| Top | 43.40 | 24.70 | 23.30 | 22.80 | ||
| Bottom | 45.20 | 24.80 | 23.90 | 23.10 |

All content, files, data and images provided by the EstuaryWatch Data Portal and Gallery are subject to a Creative Commons Attribution License
Content is made available to be used in any way, and should always attribute EstuaryWatch and www.estuarywatch.org.au