EstuaryWatch Data Portal
S3 Footbridge upstream of Great Ocean Road at Torquay
Site details
Overview
Estuary | Spring Creek Estuary |
---|---|
CMA | Corangamite CMA |
Type | Physico-Chemical |
Site code | S3 |
Site name | Footbridge upstream of Great Ocean Road at Torquay |
Nearest road and town | Great Ocean Road, Torquay |
Description | Footbridge upstream of Great Ocean Road at Torquay |
Site access | Easily accessed via walkway from Great Ocean Road. |
Land use |
|
Land use description | Road |
Status | Active |
Observation history | 08-07-2007 - 04-09-2022 |
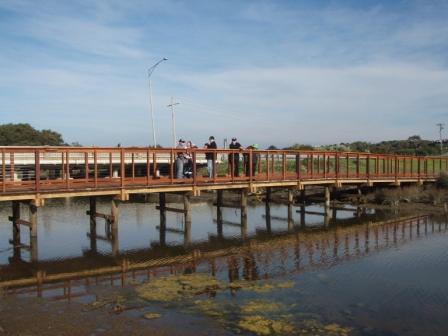
![]() Photo of phys/chem monitoring site S3 |
Observations
Turbidity tubes do not measure below 9 NTU; Chart values of 9 should be interpreted as < 9 NTU
Observations
Date | 08-04-2022 | 22-04-2022 | 28-05-2022 | 01-07-2022 | 06-08-2022 | 04-09-2022 |
---|---|---|---|---|---|---|
Observation | #14784 | #14811 | #14815 | #14859 | #14925 | #15014 |
Observation summaries
Turbidity NTU
08-04-2022 | 22-04-2022 | 28-05-2022 | 01-07-2022 | 06-08-2022 | 04-09-2022 | |
---|---|---|---|---|---|---|
Top | 14.0 | 9.0 | 9.0 | 9.0 | 9.0 | 24.0 |
Bottom | 22.0 | 9.0 | 9.0 | 27.0 | 17.0 | 21.0 |
pH
08-04-2022 | 22-04-2022 | 28-05-2022 | 01-07-2022 | 06-08-2022 | 04-09-2022 | |
---|---|---|---|---|---|---|
Top | 8.2 | 7.9 | 8.1 | 8.1 | 8.0 | 7.7 |
Bottom | 8.1 | 7.8 | 8.1 | 7.5 | 8.1 | 7.5 |
Ammonia mg/L
08-04-2022 | 22-04-2022 | 28-05-2022 | 01-07-2022 | 06-08-2022 | 04-09-2022 | |
---|---|---|---|---|---|---|
Top | ||||||
Bottom |
Enterococci orgs/100mL
08-04-2022 | 22-04-2022 | 28-05-2022 | 01-07-2022 | 06-08-2022 | 04-09-2022 | |
---|---|---|---|---|---|---|
Top | ||||||
Bottom |
Temperature ° C
08-04-2022 | 22-04-2022 | 28-05-2022 | 01-07-2022 | 06-08-2022 | 04-09-2022 | |
---|---|---|---|---|---|---|
Top | 20.20 | 16.00 | 14.40 | 11.60 | 12.40 | 15.20 |
Bottom | 18.80 | 18.30 | 14.90 | 16.20 | 12.90 | 14.20 |
Salinity ppt
08-04-2022 | 22-04-2022 | 28-05-2022 | 01-07-2022 | 06-08-2022 | 04-09-2022 | |
---|---|---|---|---|---|---|
Top | 26.50 | 21.10 | 34.00 | 16.70 | 17.50 | |
Bottom | 27.30 | 31.00 | 41.80 | 29.30 | 23.60 |
D.O. mg/L
08-04-2022 | 22-04-2022 | 28-05-2022 | 01-07-2022 | 06-08-2022 | 04-09-2022 | |
---|---|---|---|---|---|---|
Top | 9.29 | 9.19 | 10.49 | 11.17 | 10.19 | 10.11 |
Bottom | 9.06 | 5.21 | 11.20 | 6.01 | 9.19 | 9.00 |
D.O. % Sat
08-04-2022 | 22-04-2022 | 28-05-2022 | 01-07-2022 | 06-08-2022 | 04-09-2022 | |
---|---|---|---|---|---|---|
Top | 102.10 | 91.80 | 103.10 | 101.50 | 96.50 | 99.70 |
Bottom | 96.90 | 54.70 | 111.60 | 60.50 | 87.90 | 54.00 |
Conductivity mS/cm
08-04-2022 | 22-04-2022 | 28-05-2022 | 01-07-2022 | 06-08-2022 | 04-09-2022 | |
---|---|---|---|---|---|---|
Top | 37.50 | 27.80 | 41.20 | 20.25 | 21.50 | |
Bottom | 37.40 | 41.40 | 50.10 | 37.60 | 28.60 |

All content, files, data and images provided by the EstuaryWatch Data Portal and Gallery are subject to a Creative Commons Attribution License
Content is made available to be used in any way, and should always attribute EstuaryWatch and www.estuarywatch.org.au