EstuaryWatch Data Portal
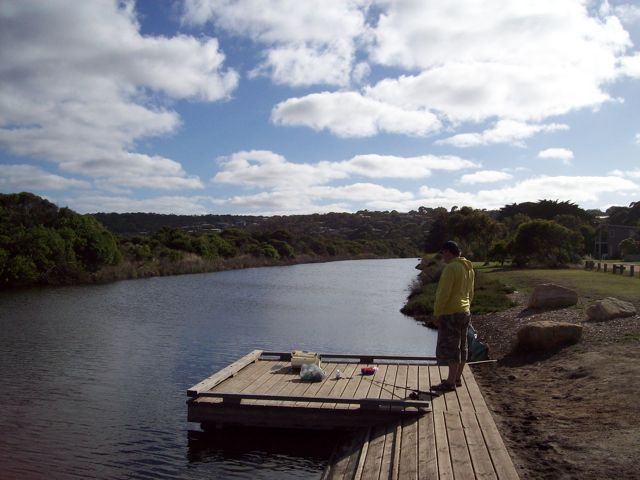
P3 Coastal Court Fishing Platform
Site details
Overview
| Estuary | Painkalac Creek Estuary |
|---|---|
| CMA | Corangamite CMA |
| Type | Physico-Chemical |
| Site code | P3 |
| Site name | Coastal Court Fishing Platform |
| Nearest road and town | Coastal Court, Aireys Inlet |
| Description | Fishing platform adjacent to Coastal Court |
| Site access | Via Coastal Court |
| Land use |
|
| Land use description | Road/Open space reserve (eastern bank), and native bushland (western bank). |
| Status | Active |
| Observation history | 14-07-2007 - 10-03-2024 |
P3: Coastal Court Fishing Platform |
|
Observations
Turbidity tubes do not measure below 9 NTU; Chart values of 9 should be interpreted as < 9 NTU
Observations
| Date | 10-09-2023 | 10-12-2023 | 13-01-2024 | 11-02-2024 | 10-03-2024 |
|---|---|---|---|---|---|
| Observation | #15761 | #15927 | #15989 | #16022 | #16060 |
Observation summaries
Turbidity NTU
| 10-09-2023 | 10-12-2023 | 13-01-2024 | 11-02-2024 | 10-03-2024 | |
|---|---|---|---|---|---|
| Top | 9.0 | 11.5 | 12.0 | 9.0 | 9.0 |
| Bottom | 9.0 | 11.0 | 10.0 | 9.0 | 9.0 |
pH
| 10-09-2023 | 10-12-2023 | 13-01-2024 | 11-02-2024 | 10-03-2024 | |
|---|---|---|---|---|---|
| Top | 6.9 | 7.7 | 7.6 | 7.7 | 7.3 |
| Bottom | 7.8 | 7.4 | 7.7 | 7.7 | 7.5 |
Ammonia mg/L
| 10-09-2023 | 10-12-2023 | 13-01-2024 | 11-02-2024 | 10-03-2024 | |
|---|---|---|---|---|---|
| Top | |||||
| Bottom |
Enterococci orgs/100mL
| 10-09-2023 | 10-12-2023 | 13-01-2024 | 11-02-2024 | 10-03-2024 | |
|---|---|---|---|---|---|
| Top | |||||
| Bottom |
Temperature ° C
| 10-09-2023 | 10-12-2023 | 13-01-2024 | 11-02-2024 | 10-03-2024 | |
|---|---|---|---|---|---|
| Top | 11.60 | 20.80 | 22.90 | 22.00 | 23.40 |
| Bottom | 18.00 | 23.30 | 23.70 | 21.20 | 21.90 |
Salinity ppt
| 10-09-2023 | 10-12-2023 | 13-01-2024 | 11-02-2024 | 10-03-2024 | |
|---|---|---|---|---|---|
| Top | 12.20 | 6.50 | 11.00 | 23.10 | 22.70 |
| Bottom | 31.30 | 26.90 | 35.80 | 25.30 | 25.30 |
D.O. mg/L
| 10-09-2023 | 10-12-2023 | 13-01-2024 | 11-02-2024 | 10-03-2024 | |
|---|---|---|---|---|---|
| Top | 10.97 | 7.71 | 8.12 | 7.86 | 7.10 |
| Bottom | 5.38 | 5.68 | 4.54 | 7.68 | 5.66 |
D.O. % Sat
| 10-09-2023 | 10-12-2023 | 13-01-2024 | 11-02-2024 | 10-03-2024 | |
|---|---|---|---|---|---|
| Top | 99.90 | 86.90 | 93.90 | 88.50 | 84.60 |
| Bottom | 56.50 | 66.90 | 52.80 | 86.00 | 64.60 |
Conductivity mS/cm
| 10-09-2023 | 10-12-2023 | 13-01-2024 | 11-02-2024 | 10-03-2024 | |
|---|---|---|---|---|---|
| Top | 15.22 | 10.51 | 17.79 | 34.40 | 34.90 |
| Bottom | 41.50 | 40.50 | 52.70 | 36.70 | 37.30 |

All content, files, data and images provided by the EstuaryWatch Data Portal and Gallery are subject to a Creative Commons Attribution License
Content is made available to be used in any way, and should always attribute EstuaryWatch and www.estuarywatch.org.au