EstuaryWatch Data Portal
P5 Woods Property Fairhaven
Site details
Overview
| Estuary | Painkalac Creek Estuary |
|---|---|
| CMA | Corangamite CMA |
| Type | Physico-Chemical |
| Site code | P5 |
| Site name | Woods Property Fairhaven |
| Nearest road and town | Bimbadeen Drive, Fairhaven |
| Description | Fishing jetty at private property. Property owner consent required for access. |
| Site access | Access through woods property (i.e. private property) along estuary bank towards the fishing platform. |
| Land use |
|
| Land use description | Open space |
| Status | Active |
| Observation history | 23-05-2007 - 14-04-2024 |
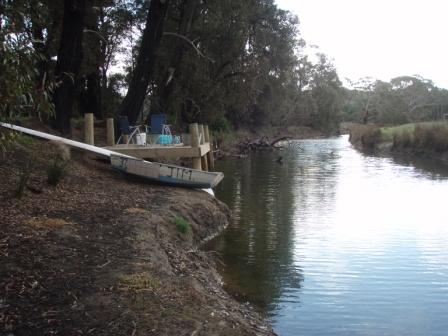
Photo of phys/chem site P5 |
|
Observations
Turbidity tubes do not measure below 9 NTU; Chart values of 9 should be interpreted as < 9 NTU
Observations
| Date | 14-05-2023 | 04-06-2023 | 13-08-2023 | 10-09-2023 | 15-10-2023 | 12-11-2023 | 10-12-2023 | 13-01-2024 | 11-02-2024 | 10-03-2024 | 14-04-2024 |
|---|---|---|---|---|---|---|---|---|---|---|---|
| Observation | #15529 | #15599 | #15772 | #15764 | #15803 | #15872 | #15925 | #15991 | #16020 | #16058 | #16116 |
Observation summaries
Turbidity NTU
| 14-05-2023 | 04-06-2023 | 13-08-2023 | 10-09-2023 | 15-10-2023 | 12-11-2023 | 10-12-2023 | 13-01-2024 | 11-02-2024 | 10-03-2024 | 14-04-2024 | |
|---|---|---|---|---|---|---|---|---|---|---|---|
| Top | 9.0 | 9.0 | 9.0 | 9.0 | 9.0 | 9.0 | 11.0 | 24.0 | 12.0 | 9.0 | 9.0 |
| Bottom | 9.0 | 9.0 | 9.0 | 9.0 | 9.0 | 9.0 | 12.0 | 9.0 | 9.0 | 9.0 | 9.0 |
pH
| 14-05-2023 | 04-06-2023 | 13-08-2023 | 10-09-2023 | 15-10-2023 | 12-11-2023 | 10-12-2023 | 13-01-2024 | 11-02-2024 | 10-03-2024 | 14-04-2024 | |
|---|---|---|---|---|---|---|---|---|---|---|---|
| Top | 7.2 | 6.9 | 6.5 | 7.4 | 7.5 | 6.7 | 6.8 | 7.2 | 6.9 | 7.5 | 7.4 |
| Bottom | 7.5 | 7.2 | 6.6 | 7.1 | 7.5 | 6.9 | 7.1 | 6.9 | 7.1 | 7.4 | 7.3 |
Ammonia mg/L
| 14-05-2023 | 04-06-2023 | 13-08-2023 | 10-09-2023 | 15-10-2023 | 12-11-2023 | 10-12-2023 | 13-01-2024 | 11-02-2024 | 10-03-2024 | 14-04-2024 | |
|---|---|---|---|---|---|---|---|---|---|---|---|
| Top | |||||||||||
| Bottom |
Enterococci orgs/100mL
| 14-05-2023 | 04-06-2023 | 13-08-2023 | 10-09-2023 | 15-10-2023 | 12-11-2023 | 10-12-2023 | 13-01-2024 | 11-02-2024 | 10-03-2024 | 14-04-2024 | |
|---|---|---|---|---|---|---|---|---|---|---|---|
| Top | |||||||||||
| Bottom |
Temperature ° C
| 14-05-2023 | 04-06-2023 | 13-08-2023 | 10-09-2023 | 15-10-2023 | 12-11-2023 | 10-12-2023 | 13-01-2024 | 11-02-2024 | 10-03-2024 | 14-04-2024 | |
|---|---|---|---|---|---|---|---|---|---|---|---|
| Top | 15.70 | 12.60 | 12.10 | 14.30 | 16.10 | 18.90 | 19.00 | 21.00 | 21.00 | 24.40 | 20.70 |
| Bottom | 16.90 | 14.60 | 16.40 | 18.50 | 21.70 | 23.30 | 22.60 | 23.10 | 27.30 | 23.00 | 21.50 |
Salinity ppt
| 14-05-2023 | 04-06-2023 | 13-08-2023 | 10-09-2023 | 15-10-2023 | 12-11-2023 | 10-12-2023 | 13-01-2024 | 11-02-2024 | 10-03-2024 | 14-04-2024 | |
|---|---|---|---|---|---|---|---|---|---|---|---|
| Top | 11.40 | 3.10 | 11.70 | 14.40 | 5.40 | 3.70 | 1.10 | 1.10 | 10.20 | 19.80 | |
| Bottom | 14.00 | 12.50 | 34.40 | 27.70 | 19.40 | 9.80 | 9.90 | 26.00 | 23.40 | 23.10 |
D.O. mg/L
| 14-05-2023 | 04-06-2023 | 13-08-2023 | 10-09-2023 | 15-10-2023 | 12-11-2023 | 10-12-2023 | 13-01-2024 | 11-02-2024 | 10-03-2024 | 14-04-2024 | |
|---|---|---|---|---|---|---|---|---|---|---|---|
| Top | 7.80 | 9.31 | 9.60 | 10.43 | 8.70 | 7.54 | 7.40 | 7.30 | 6.72 | 5.26 | 6.89 |
| Bottom | 4.97 | 7.30 | 4.23 | 6.18 | 4.00 | 4.47 | 7.10 | 2.05 | 5.68 | 5.42 | 4.02 |
D.O. % Sat
| 14-05-2023 | 04-06-2023 | 13-08-2023 | 10-09-2023 | 15-10-2023 | 12-11-2023 | 10-12-2023 | 13-01-2024 | 11-02-2024 | 10-03-2024 | 14-04-2024 | |
|---|---|---|---|---|---|---|---|---|---|---|---|
| Top | 78.70 | 86.40 | 89.50 | 100.60 | 88.00 | 81.10 | 80.70 | 82.00 | 74.90 | 63.00 | 76.80 |
| Bottom | 51.20 | 70.80 | 43.30 | 65.40 | 47.50 | 52.20 | 82.00 | 26.00 | 71.00 | 63.00 | 45.50 |
Conductivity mS/cm
| 14-05-2023 | 04-06-2023 | 13-08-2023 | 10-09-2023 | 15-10-2023 | 12-11-2023 | 10-12-2023 | 13-01-2024 | 11-02-2024 | 10-03-2024 | 14-04-2024 | |
|---|---|---|---|---|---|---|---|---|---|---|---|
| Top | 15.74 | 4.30 | 14.80 | 18.80 | 8.00 | 5.92 | 1.60 | 1.52 | 16.00 | 29.10 | |
| Bottom | 19.50 | 16.65 | 43.60 | 37.60 | 29.20 | 16.09 | 16.00 | 39.10 | 38.70 | 34.10 |

All content, files, data and images provided by the EstuaryWatch Data Portal and Gallery are subject to a Creative Commons Attribution License
Content is made available to be used in any way, and should always attribute EstuaryWatch and www.estuarywatch.org.au