EstuaryWatch Data Portal
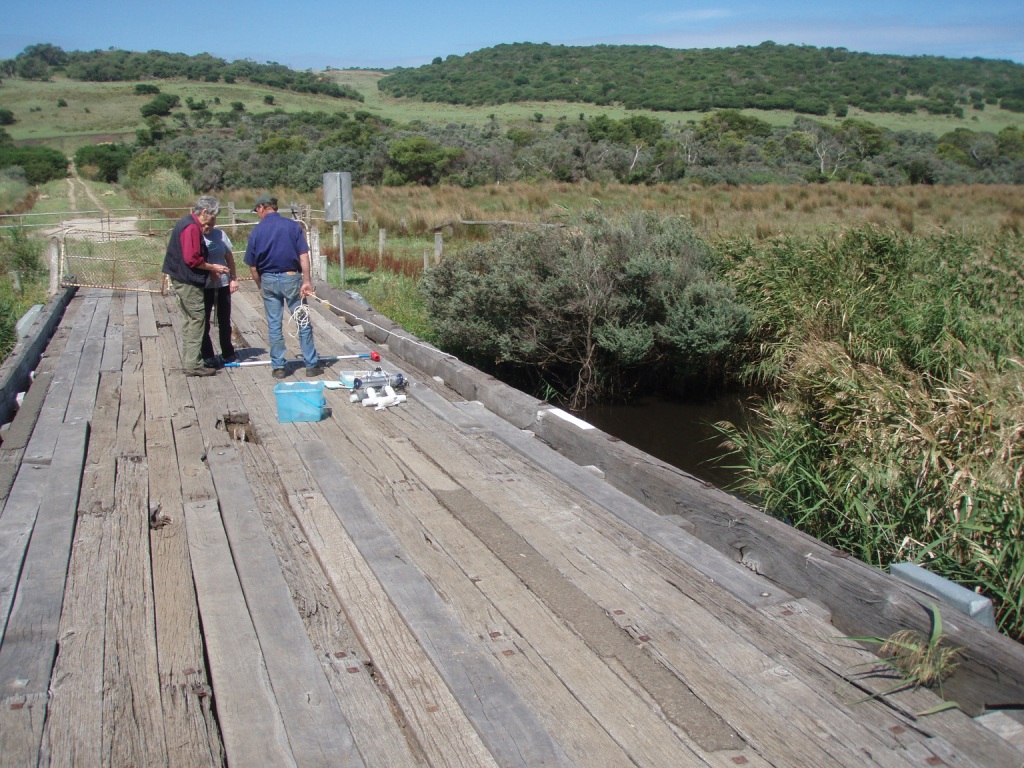
G4 Bridge at Rivernook
Site details
Overview
| Estuary | Gellibrand River Estuary |
|---|---|
| CMA | Corangamite CMA |
| Type | Physico-Chemical |
| Site code | G4 |
| Site name | Bridge at Rivernook |
| Nearest road and town | Old Ocean Road, Princetown |
| Description | Bridge at Rivernook |
| Site access | Access via Old Ocean Road. The first bridge over the river you come to. |
| Land use |
|
| Land use description | Grazing area. |
| Status | Active |
| Observation history | 21-04-2007 - 15-03-2024 |
Phys/Chem Monitoring Site Four. |
|
Observations
Turbidity tubes do not measure below 9 NTU; Chart values of 9 should be interpreted as < 9 NTU
Observations
| Date | 19-05-2023 | 16-06-2023 | 21-07-2023 | 25-08-2023 | 15-09-2023 | 20-10-2023 | 17-11-2023 | 22-12-2023 | 19-01-2024 | 16-02-2024 | 15-03-2024 |
|---|---|---|---|---|---|---|---|---|---|---|---|
| Observation | #15533 | #15580 | #15671 | #15722 | #15748 | #15818 | #15867 | #15952 | #16034 | #16038 | #16126 |
Observation summaries
Turbidity NTU
| 19-05-2023 | 16-06-2023 | 21-07-2023 | 25-08-2023 | 15-09-2023 | 20-10-2023 | 17-11-2023 | 22-12-2023 | 19-01-2024 | 16-02-2024 | 15-03-2024 | |
|---|---|---|---|---|---|---|---|---|---|---|---|
| Top | 10.0 | 50.0 | 24.0 | 30.0 | 27.0 | 30.0 | 9.0 | 9.0 | 9.0 | 9.0 | 9.0 |
| Bottom | 11.0 | 50.0 | 23.0 | 30.0 | 27.0 | 30.0 | 9.0 | 9.0 | 9.0 | 17.0 | 9.0 |
pH
| 19-05-2023 | 16-06-2023 | 21-07-2023 | 25-08-2023 | 15-09-2023 | 20-10-2023 | 17-11-2023 | 22-12-2023 | 19-01-2024 | 16-02-2024 | 15-03-2024 | |
|---|---|---|---|---|---|---|---|---|---|---|---|
| Top | 7.2 | 6.9 | 7.1 | 6.9 | 7.2 | 7.1 | 6.9 | 6.9 | 6.7 | 6.9 | 6.8 |
| Bottom | 7.2 | 6.8 | 7.0 | 7.0 | 7.1 | 7.2 | 7.4 | 6.9 | 6.8 | 7.2 | 7.1 |
Ammonia mg/L
| 19-05-2023 | 16-06-2023 | 21-07-2023 | 25-08-2023 | 15-09-2023 | 20-10-2023 | 17-11-2023 | 22-12-2023 | 19-01-2024 | 16-02-2024 | 15-03-2024 | |
|---|---|---|---|---|---|---|---|---|---|---|---|
| Top | |||||||||||
| Bottom |
Enterococci orgs/100mL
| 19-05-2023 | 16-06-2023 | 21-07-2023 | 25-08-2023 | 15-09-2023 | 20-10-2023 | 17-11-2023 | 22-12-2023 | 19-01-2024 | 16-02-2024 | 15-03-2024 | |
|---|---|---|---|---|---|---|---|---|---|---|---|
| Top | |||||||||||
| Bottom |
Temperature ° C
| 19-05-2023 | 16-06-2023 | 21-07-2023 | 25-08-2023 | 15-09-2023 | 20-10-2023 | 17-11-2023 | 22-12-2023 | 19-01-2024 | 16-02-2024 | 15-03-2024 | |
|---|---|---|---|---|---|---|---|---|---|---|---|
| Top | 10.60 | 11.00 | 8.80 | 11.40 | 12.50 | 14.20 | 14.80 | 17.20 | 17.90 | 17.90 | 18.20 |
| Bottom | 10.30 | 10.80 | 8.80 | 11.20 | 12.10 | 13.80 | 15.70 | 17.00 | 18.60 | 18.90 | 19.60 |
Salinity ppt
| 19-05-2023 | 16-06-2023 | 21-07-2023 | 25-08-2023 | 15-09-2023 | 20-10-2023 | 17-11-2023 | 22-12-2023 | 19-01-2024 | 16-02-2024 | 15-03-2024 | |
|---|---|---|---|---|---|---|---|---|---|---|---|
| Top | 0.20 | 0.20 | 0.20 | 0.20 | 0.20 | 0.20 | 0.20 | 0.20 | 0.20 | 0.90 | 1.40 |
| Bottom | 0.20 | 0.20 | 0.20 | 0.20 | 0.20 | 0.20 | 29.30 | 0.20 | 22.80 | 30.50 | 30.70 |
D.O. mg/L
| 19-05-2023 | 16-06-2023 | 21-07-2023 | 25-08-2023 | 15-09-2023 | 20-10-2023 | 17-11-2023 | 22-12-2023 | 19-01-2024 | 16-02-2024 | 15-03-2024 | |
|---|---|---|---|---|---|---|---|---|---|---|---|
| Top | 10.25 | 9.25 | 10.42 | 9.81 | 9.91 | 9.36 | 8.62 | 8.20 | 7.04 | 6.81 | 6.28 |
| Bottom | 10.22 | 9.16 | 10.33 | 9.68 | 9.89 | 9.30 | 7.37 | 8.15 | 4.18 | 3.09 | 3.02 |
D.O. % Sat
| 19-05-2023 | 16-06-2023 | 21-07-2023 | 25-08-2023 | 15-09-2023 | 20-10-2023 | 17-11-2023 | 22-12-2023 | 19-01-2024 | 16-02-2024 | 15-03-2024 | |
|---|---|---|---|---|---|---|---|---|---|---|---|
| Top | 97.70 | 89.10 | 94.90 | 95.20 | 98.50 | 96.60 | 89.10 | 90.70 | 78.70 | 76.10 | 71.20 |
| Bottom | 97.20 | 87.70 | 93.90 | 93.60 | 97.90 | 96.10 | 78.50 | 89.90 | 47.40 | 34.90 | 35.30 |
Conductivity mS/cm
| 19-05-2023 | 16-06-2023 | 21-07-2023 | 25-08-2023 | 15-09-2023 | 20-10-2023 | 17-11-2023 | 22-12-2023 | 19-01-2024 | 16-02-2024 | 15-03-2024 | |
|---|---|---|---|---|---|---|---|---|---|---|---|
| Top | 0.31 | 0.32 | 0.30 | 0.29 | 0.31 | 0.28 | 0.30 | 0.29 | 0.28 | 1.34 | 2.00 |
| Bottom | 0.31 | 0.32 | 0.30 | 0.29 | 0.31 | 0.29 | 41.80 | 0.29 | 32.70 | 43.60 | 43.90 |

All content, files, data and images provided by the EstuaryWatch Data Portal and Gallery are subject to a Creative Commons Attribution License
Content is made available to be used in any way, and should always attribute EstuaryWatch and www.estuarywatch.org.au