EstuaryWatch Data Portal
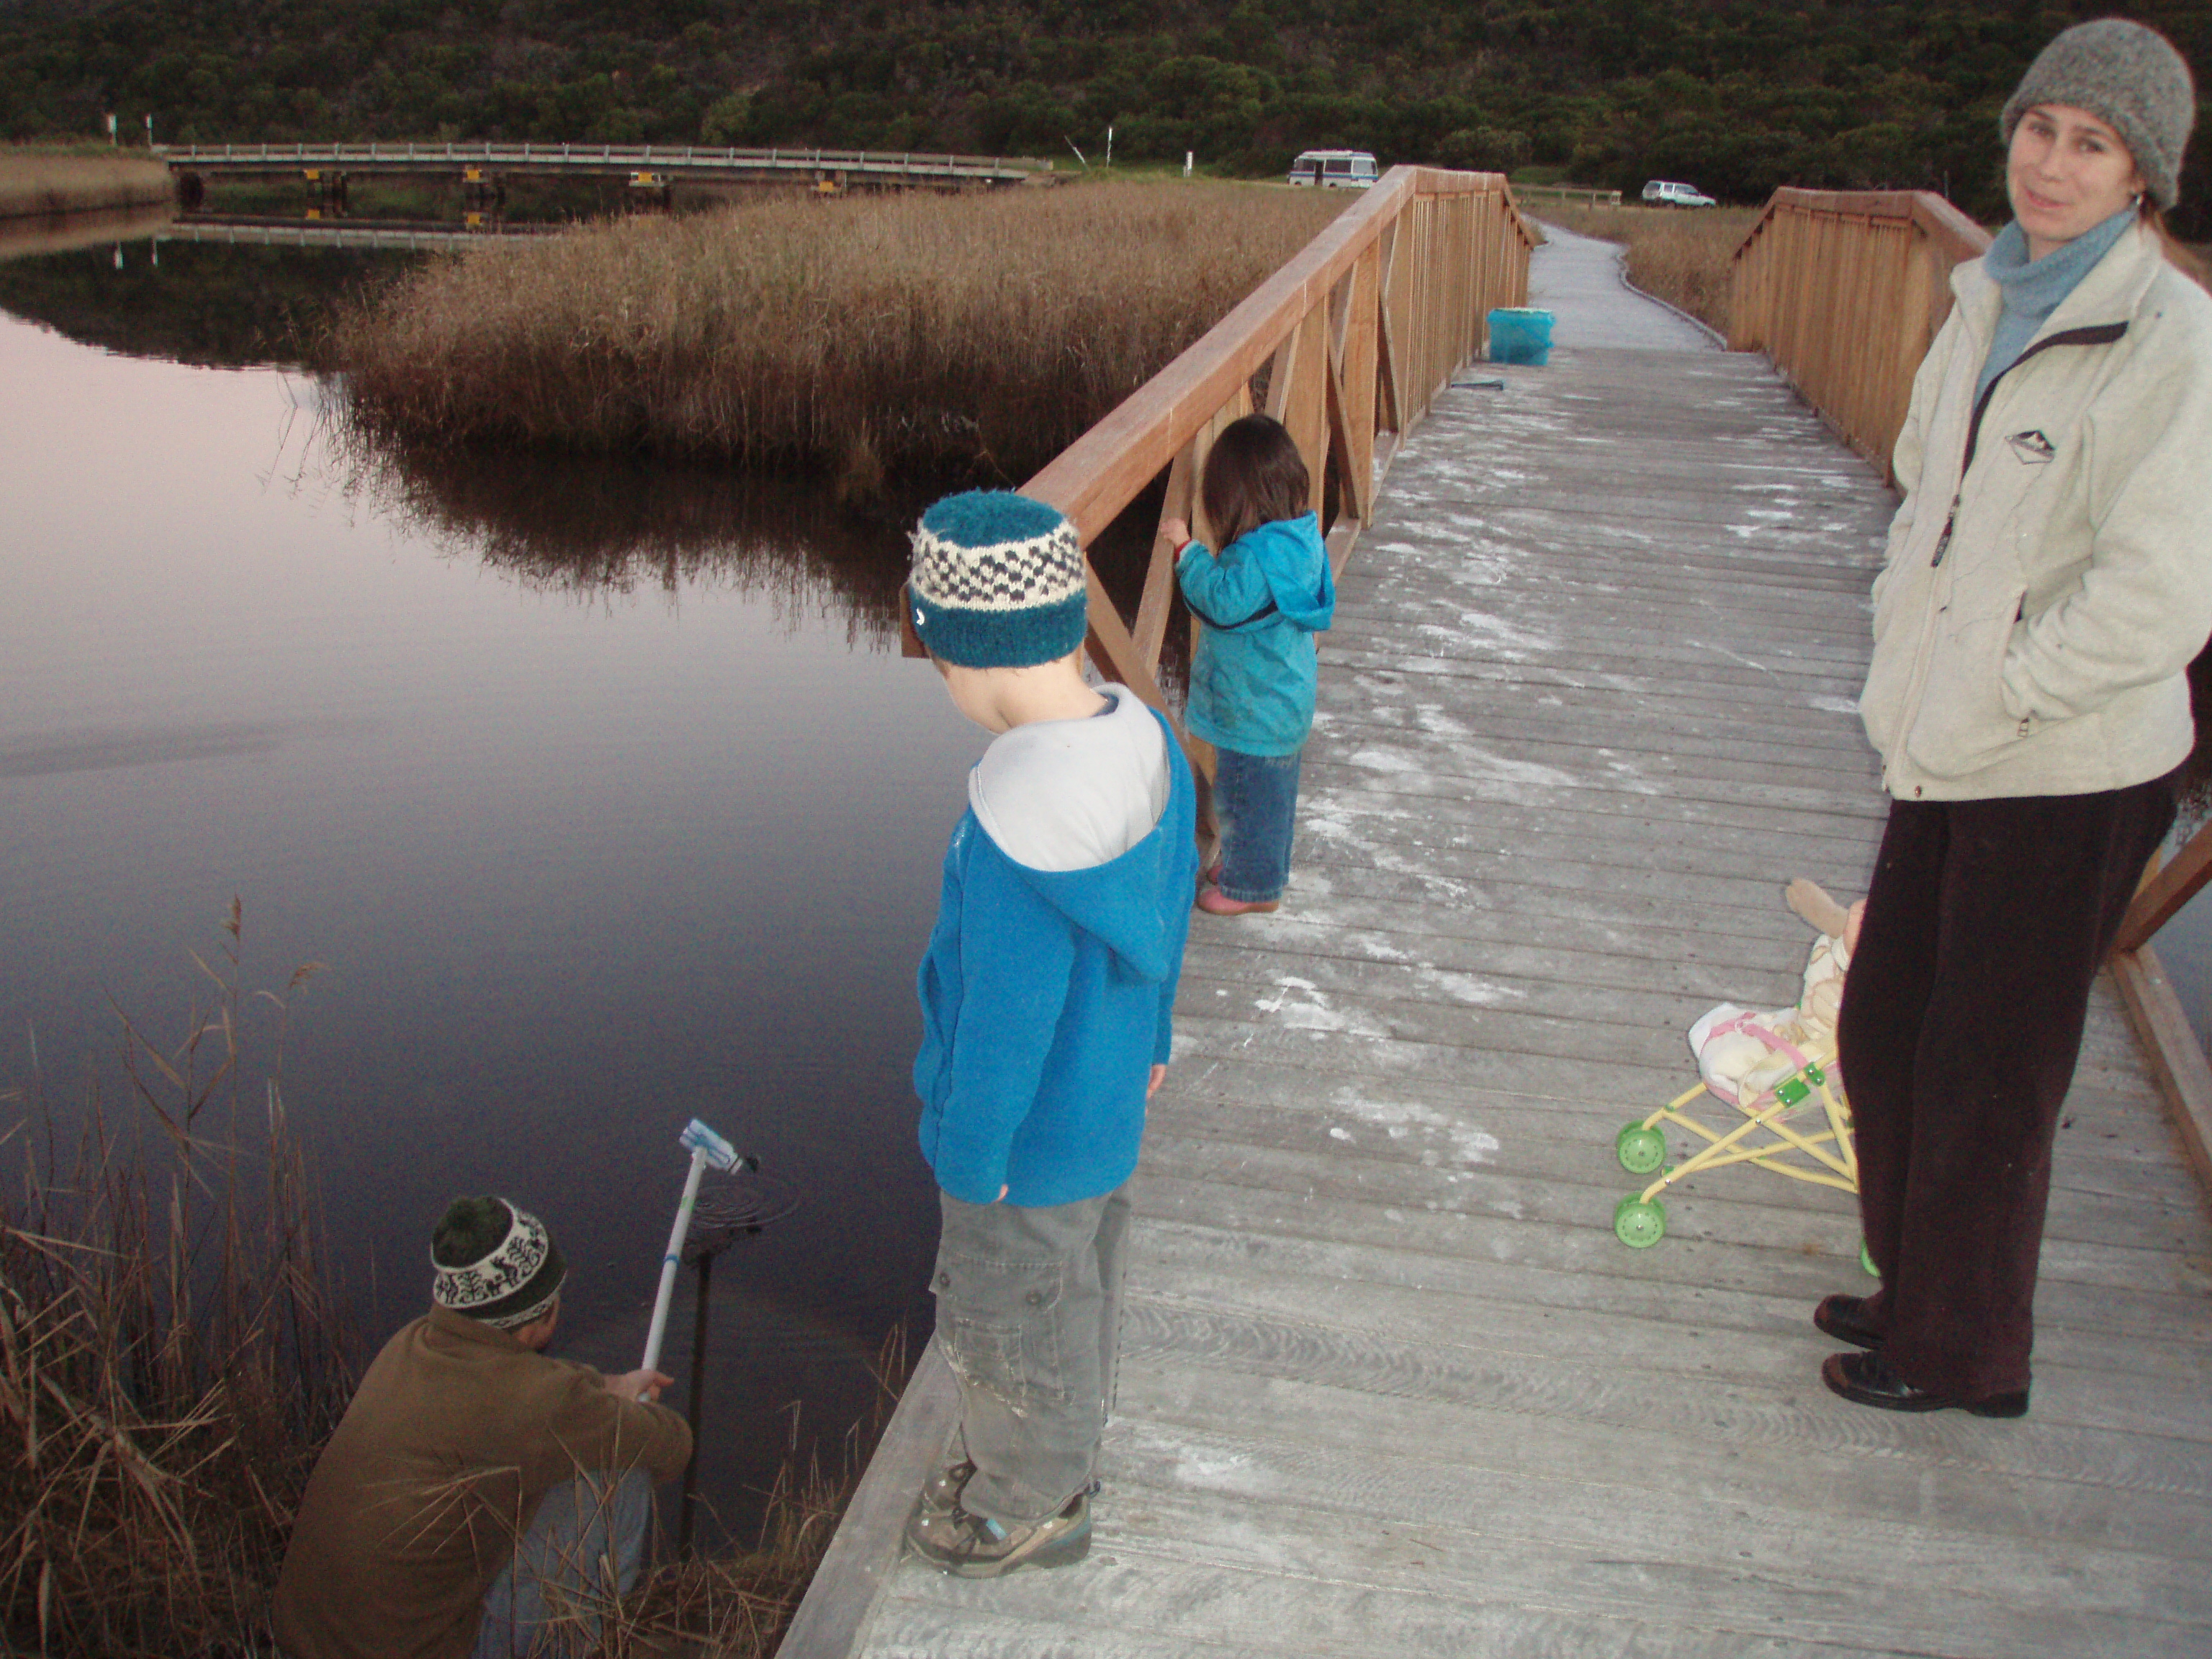
L1 Bridge at Latrobe Creek Mouth as it enters the Gellibrand
Site details
Overview
| Estuary | Gellibrand River Estuary |
|---|---|
| CMA | Corangamite CMA |
| Type | Physico-Chemical |
| Site code | L1 |
| Site name | Bridge at Latrobe Creek Mouth as it enters the Gellibrand |
| Nearest road and town | none |
| Description | Foot bridge over wetlands |
| Site access | Head north from site G2 (Old Coach Road bridge) along the western side of the river. |
| Land use |
|
| Land use description | |
| Status | Active |
| Observation history | 15-06-2007 - 15-03-2024 |
Bridge at Latrobe Creek Mouth |
|
Observations
Turbidity tubes do not measure below 9 NTU; Chart values of 9 should be interpreted as < 9 NTU
Observations
| Date | 19-05-2023 | 16-06-2023 | 21-07-2023 | 25-08-2023 | 15-09-2023 | 20-10-2023 | 17-11-2023 | 22-12-2023 | 19-01-2024 | 16-02-2024 | 15-03-2024 |
|---|---|---|---|---|---|---|---|---|---|---|---|
| Observation | #15535 | #15587 | #15673 | #15723 | #15749 | #15819 | #15868 | #15953 | #16035 | #16039 | #16127 |
Observation summaries
Turbidity NTU
| 19-05-2023 | 16-06-2023 | 21-07-2023 | 25-08-2023 | 15-09-2023 | 20-10-2023 | 17-11-2023 | 22-12-2023 | 19-01-2024 | 16-02-2024 | 15-03-2024 | |
|---|---|---|---|---|---|---|---|---|---|---|---|
| Top | 9.0 | 40.0 | 18.0 | 24.0 | 17.0 | 24.0 | 9.0 | 9.0 | 9.0 | 9.0 | 9.0 |
| Bottom | 60.0 | 40.0 | 14.0 | 21.0 | 21.0 | 24.0 | 17.0 | 24.0 | 11.0 | 30.0 | 15.0 |
pH
| 19-05-2023 | 16-06-2023 | 21-07-2023 | 25-08-2023 | 15-09-2023 | 20-10-2023 | 17-11-2023 | 22-12-2023 | 19-01-2024 | 16-02-2024 | 15-03-2024 | |
|---|---|---|---|---|---|---|---|---|---|---|---|
| Top | 7.4 | 7.0 | 6.9 | 7.0 | 7.2 | 7.0 | 7.2 | 7.0 | 7.1 | 7.3 | 7.5 |
| Bottom | 7.2 | 7.2 | 7.5 | 7.2 | 6.9 | 7.4 | 8.0 | 6.9 | 7.1 | 7.9 | 7.5 |
Ammonia mg/L
| 19-05-2023 | 16-06-2023 | 21-07-2023 | 25-08-2023 | 15-09-2023 | 20-10-2023 | 17-11-2023 | 22-12-2023 | 19-01-2024 | 16-02-2024 | 15-03-2024 | |
|---|---|---|---|---|---|---|---|---|---|---|---|
| Top | |||||||||||
| Bottom |
Enterococci orgs/100mL
| 19-05-2023 | 16-06-2023 | 21-07-2023 | 25-08-2023 | 15-09-2023 | 20-10-2023 | 17-11-2023 | 22-12-2023 | 19-01-2024 | 16-02-2024 | 15-03-2024 | |
|---|---|---|---|---|---|---|---|---|---|---|---|
| Top | |||||||||||
| Bottom |
Temperature ° C
| 19-05-2023 | 16-06-2023 | 21-07-2023 | 25-08-2023 | 15-09-2023 | 20-10-2023 | 17-11-2023 | 22-12-2023 | 19-01-2024 | 16-02-2024 | 15-03-2024 | |
|---|---|---|---|---|---|---|---|---|---|---|---|
| Top | 11.30 | 11.00 | 8.90 | 11.50 | 12.80 | 15.10 | 15.70 | 18.60 | 18.10 | 19.30 | 18.30 |
| Bottom | 12.80 | 11.00 | 8.80 | 11.30 | 12.80 | 14.50 | 15.90 | 16.90 | 17.40 | 18.40 | 19.10 |
Salinity ppt
| 19-05-2023 | 16-06-2023 | 21-07-2023 | 25-08-2023 | 15-09-2023 | 20-10-2023 | 17-11-2023 | 22-12-2023 | 19-01-2024 | 16-02-2024 | 15-03-2024 | |
|---|---|---|---|---|---|---|---|---|---|---|---|
| Top | 0.60 | 0.30 | 0.30 | 0.30 | 1.10 | 4.80 | 3.00 | 3.90 | 5.30 | 4.40 | |
| Bottom | 21.40 | 0.80 | 1.60 | 1.30 | 1.80 | 30.40 | 36.60 | 33.10 | 33.10 | 36.20 | 32.70 |
D.O. mg/L
| 19-05-2023 | 16-06-2023 | 21-07-2023 | 25-08-2023 | 15-09-2023 | 20-10-2023 | 17-11-2023 | 22-12-2023 | 19-01-2024 | 16-02-2024 | 15-03-2024 | |
|---|---|---|---|---|---|---|---|---|---|---|---|
| Top | 10.03 | 9.14 | 10.20 | 9.56 | 9.80 | 8.81 | 8.85 | 8.63 | 7.84 | 7.58 | 8.05 |
| Bottom | 8.11 | 7.14 | 9.89 | 7.78 | 8.62 | 4.67 | 9.95 | 5.52 | 9.37 | 0.79 | 4.51 |
D.O. % Sat
| 19-05-2023 | 16-06-2023 | 21-07-2023 | 25-08-2023 | 15-09-2023 | 20-10-2023 | 17-11-2023 | 22-12-2023 | 19-01-2024 | 16-02-2024 | 15-03-2024 | |
|---|---|---|---|---|---|---|---|---|---|---|---|
| Top | 96.90 | 88.00 | 93.20 | 93.00 | 98.00 | 94.70 | 94.20 | 98.40 | 89.30 | 87.60 | 91.30 |
| Bottom | 81.10 | 68.70 | 90.10 | 75.40 | 86.40 | 49.00 | 107.00 | 60.60 | 104.10 | 9.00 | 52.00 |
Conductivity mS/cm
| 19-05-2023 | 16-06-2023 | 21-07-2023 | 25-08-2023 | 15-09-2023 | 20-10-2023 | 17-11-2023 | 22-12-2023 | 19-01-2024 | 16-02-2024 | 15-03-2024 | |
|---|---|---|---|---|---|---|---|---|---|---|---|
| Top | 0.91 | 0.42 | 0.47 | 0.40 | 1.52 | 6.90 | 4.33 | 5.51 | 6.77 | 6.26 | |
| Bottom | 26.10 | 1.21 | 2.35 | 1.90 | 2.59 | 37.40 | 52.30 | 47.30 | 47.30 | 51.70 | 46.70 |

All content, files, data and images provided by the EstuaryWatch Data Portal and Gallery are subject to a Creative Commons Attribution License
Content is made available to be used in any way, and should always attribute EstuaryWatch and www.estuarywatch.org.au