EstuaryWatch Data Portal
B2 Boat Ramp Jetty
Site details
Overview
| Estuary | Barwon River Estuary |
|---|---|
| CMA | Corangamite CMA |
| Type | Physico-Chemical |
| Site code | B2 |
| Site name | Boat Ramp Jetty |
| Nearest road and town | River Parade, Barwon Heads |
| Description | Fishing jetty adjacent boat ramp. |
| Site access | Via Barwon Heads boat ramp carpark |
| Land use |
|
| Land use description | This site is surrounded by a large section of Mangroves, the Barwon Heads boat ramp and the boat ramp carpark. |
| Status | Active |
| Observation history | 20-01-2008 - 20-03-2024 |
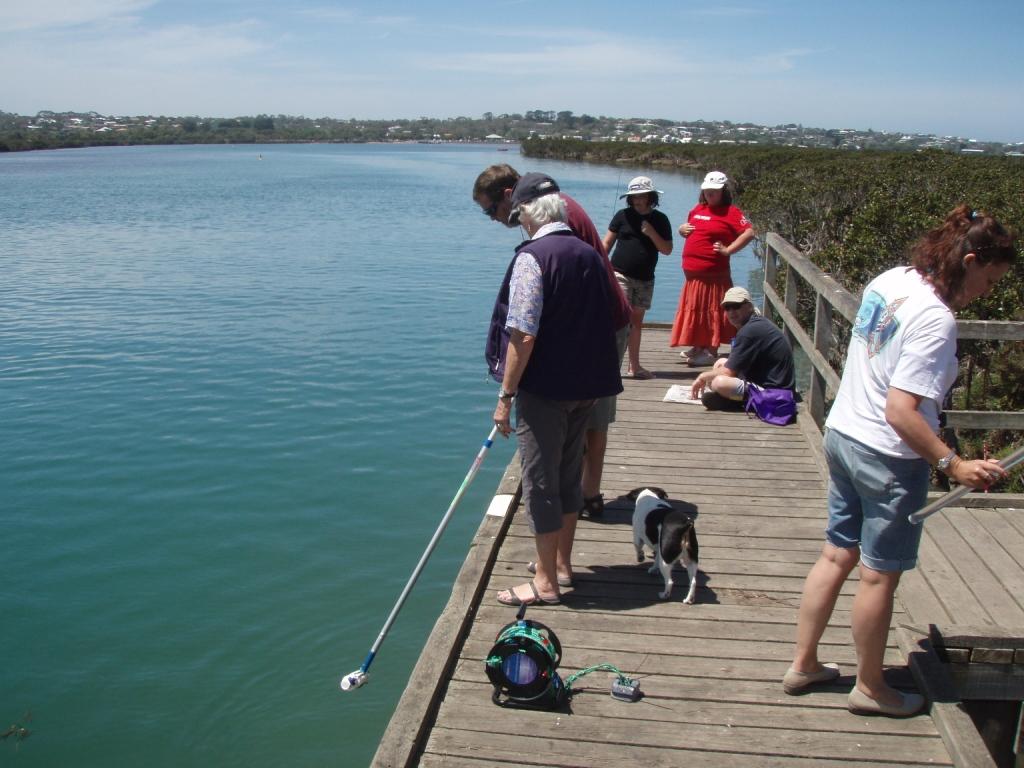
Photo os phys/chem monitoring site B2 |
|
Observations
Turbidity tubes do not measure below 9 NTU; Chart values of 9 should be interpreted as < 9 NTU
Observations
| Date | 04-05-2023 | 17-05-2023 | 01-06-2023 | 21-06-2023 | 06-07-2023 | 03-08-2023 | 16-08-2023 | 07-09-2023 | 02-11-2023 | 15-11-2023 | 07-12-2023 | 20-12-2023 | 01-02-2024 | 21-02-2024 | 07-03-2024 | 20-03-2024 |
|---|---|---|---|---|---|---|---|---|---|---|---|---|---|---|---|---|
| Observation | #15508 | #15527 | #15593 | #15676 | #15620 | #15688 | #15717 | #15740 | #15887 | #15884 | #15934 | #15930 | #16011 | #16025 | #16047 | #16075 |
Observation summaries
Turbidity NTU
| 04-05-2023 | 17-05-2023 | 01-06-2023 | 21-06-2023 | 06-07-2023 | 03-08-2023 | 16-08-2023 | 07-09-2023 | 02-11-2023 | 15-11-2023 | 07-12-2023 | 20-12-2023 | 01-02-2024 | 21-02-2024 | 07-03-2024 | 20-03-2024 | |
|---|---|---|---|---|---|---|---|---|---|---|---|---|---|---|---|---|
| Top | 10.0 | 9.0 | 9.5 | 24.0 | 29.0 | 50.0 | 9.3 | 9.0 | 9.0 | 0.0 | 0.0 | 8.0 | 9.0 | 0.0 | 9.0 | 11.0 |
| Bottom | 9.0 | 10.0 | 11.0 | 23.0 | 29.0 | 38.0 | 10.0 | 9.0 | 9.0 | 0.0 | 0.0 | 8.0 | 9.0 | 0.0 | 9.0 | 11.0 |
pH
| 04-05-2023 | 17-05-2023 | 01-06-2023 | 21-06-2023 | 06-07-2023 | 03-08-2023 | 16-08-2023 | 07-09-2023 | 02-11-2023 | 15-11-2023 | 07-12-2023 | 20-12-2023 | 01-02-2024 | 21-02-2024 | 07-03-2024 | 20-03-2024 | |
|---|---|---|---|---|---|---|---|---|---|---|---|---|---|---|---|---|
| Top | 9.2 | 7.8 | 7.8 | 8.4 | 8.3 | 8.4 | 8.2 | 8.2 | 8.4 | 8.2 | 8.4 | 8.0 | 8.4 | 7.9 | 8.0 | 8.9 |
| Bottom | 9.1 | 7.8 | 7.8 | 8.4 | 8.3 | 8.4 | 8.2 | 8.1 | 8.4 | 8.2 | 8.3 | 8.0 | 8.4 | 7.9 | 7.8 | 9.1 |
Ammonia mg/L
| 04-05-2023 | 17-05-2023 | 01-06-2023 | 21-06-2023 | 06-07-2023 | 03-08-2023 | 16-08-2023 | 07-09-2023 | 02-11-2023 | 15-11-2023 | 07-12-2023 | 20-12-2023 | 01-02-2024 | 21-02-2024 | 07-03-2024 | 20-03-2024 | |
|---|---|---|---|---|---|---|---|---|---|---|---|---|---|---|---|---|
| Top | ||||||||||||||||
| Bottom |
Enterococci orgs/100mL
| 04-05-2023 | 17-05-2023 | 01-06-2023 | 21-06-2023 | 06-07-2023 | 03-08-2023 | 16-08-2023 | 07-09-2023 | 02-11-2023 | 15-11-2023 | 07-12-2023 | 20-12-2023 | 01-02-2024 | 21-02-2024 | 07-03-2024 | 20-03-2024 | |
|---|---|---|---|---|---|---|---|---|---|---|---|---|---|---|---|---|
| Top | ||||||||||||||||
| Bottom |
Temperature ° C
| 04-05-2023 | 17-05-2023 | 01-06-2023 | 21-06-2023 | 06-07-2023 | 03-08-2023 | 16-08-2023 | 07-09-2023 | 02-11-2023 | 15-11-2023 | 07-12-2023 | 20-12-2023 | 01-02-2024 | 21-02-2024 | 07-03-2024 | 20-03-2024 | |
|---|---|---|---|---|---|---|---|---|---|---|---|---|---|---|---|---|
| Top | 13.60 | 13.30 | 13.70 | 8.20 | 10.30 | 11.50 | 11.40 | 12.50 | 14.50 | 16.30 | 19.60 | 17.50 | 20.00 | 21.60 | 19.60 | 18.40 |
| Bottom | 13.80 | 13.30 | 13.70 | 8.20 | 10.20 | 11.30 | 11.40 | 12.40 | 14.60 | 16.30 | 19.30 | 17.50 | 20.10 | 21.30 | 19.70 | 18.50 |
Salinity ppt
| 04-05-2023 | 17-05-2023 | 01-06-2023 | 21-06-2023 | 06-07-2023 | 03-08-2023 | 16-08-2023 | 07-09-2023 | 02-11-2023 | 15-11-2023 | 07-12-2023 | 20-12-2023 | 01-02-2024 | 21-02-2024 | 07-03-2024 | 20-03-2024 | |
|---|---|---|---|---|---|---|---|---|---|---|---|---|---|---|---|---|
| Top | 23.00 | 30.50 | 30.60 | 16.30 | 11.50 | 11.70 | 14.40 | 32.60 | 36.10 | 37.40 | 26.60 | 36.90 | 5.50 | 35.00 | 36.90 | 37.70 |
| Bottom | 25.50 | 31.00 | 31.20 | 16.30 | 11.30 | 11.70 | 15.70 | 33.20 | 36.00 | 37.40 | 34.80 | 36.90 | 5.40 | 35.70 | 36.80 | 37.70 |
D.O. mg/L
| 04-05-2023 | 17-05-2023 | 01-06-2023 | 21-06-2023 | 06-07-2023 | 03-08-2023 | 16-08-2023 | 07-09-2023 | 02-11-2023 | 15-11-2023 | 07-12-2023 | 20-12-2023 | 01-02-2024 | 21-02-2024 | 07-03-2024 | 20-03-2024 | |
|---|---|---|---|---|---|---|---|---|---|---|---|---|---|---|---|---|
| Top | 10.04 | 9.57 | 9.19 | 12.21 | 11.04 | 10.73 | 84.60 | 9.95 | 9.38 | 8.91 | 7.72 | 9.27 | 50.20 | 7.33 | 8.31 | 8.20 |
| Bottom | 9.57 | 9.46 | 9.13 | 12.18 | 11.06 | 10.76 | 80.90 | 9.94 | 9.27 | 8.87 | 7.99 | 9.21 | 50.10 | 7.25 | 8.17 | 8.04 |
D.O. % Sat
| 04-05-2023 | 17-05-2023 | 01-06-2023 | 21-06-2023 | 06-07-2023 | 03-08-2023 | 16-08-2023 | 07-09-2023 | 02-11-2023 | 15-11-2023 | 07-12-2023 | 20-12-2023 | 01-02-2024 | 21-02-2024 | 07-03-2024 | 20-03-2024 | |
|---|---|---|---|---|---|---|---|---|---|---|---|---|---|---|---|---|
| Top | 96.80 | 90.60 | 88.70 | 103.20 | 99.60 | 97.90 | 84.60 | 94.50 | 91.60 | 91.50 | 83.80 | 96.90 | 86.40 | 83.80 | 90.00 | 86.90 |
| Bottom | 92.40 | 89.70 | 88.20 | 102.90 | 99.50 | 97.50 | 80.90 | 94.40 | 90.80 | 91.20 | 86.90 | 96.30 | 85.40 | 82.40 | 89.00 | 85.60 |
Conductivity mS/cm
| 04-05-2023 | 17-05-2023 | 01-06-2023 | 21-06-2023 | 06-07-2023 | 03-08-2023 | 16-08-2023 | 07-09-2023 | 02-11-2023 | 15-11-2023 | 07-12-2023 | 20-12-2023 | 01-02-2024 | 21-02-2024 | 07-03-2024 | 20-03-2024 | |
|---|---|---|---|---|---|---|---|---|---|---|---|---|---|---|---|---|
| Top | 32.80 | 43.60 | 43.70 | 23.30 | 16.38 | 16.68 | 20.60 | 46.60 | 51.50 | 53.40 | 38.00 | 52.70 | 7.82 | 50.00 | 52.70 | 53.90 |
| Bottom | 36.40 | 44.30 | 44.50 | 23.30 | 16.12 | 16.70 | 22.50 | 47.40 | 51.40 | 53.40 | 49.70 | 52.70 | 7.72 | 51.00 | 52.60 | 53.80 |

All content, files, data and images provided by the EstuaryWatch Data Portal and Gallery are subject to a Creative Commons Attribution License
Content is made available to be used in any way, and should always attribute EstuaryWatch and www.estuarywatch.org.au