EstuaryWatch Data Portal
H3 Site three (Mahoneys Road)
Site details
Overview
| Estuary | Hopkins River Estuary |
|---|---|
| CMA | Glenelg Hopkins CMA |
| Type | Physico-Chemical |
| Site code | H3 |
| Site name | Site three (Mahoneys Road) |
| Nearest road and town | Mahoneys Road, Warrnambool |
| Description | Fishing pontoon located on the oceanside of the boat ramp. Monitoring is conducted off the end of the pontoon. |
| Site access | Turn off the Princess Hwy onto Mahoneys Road. Follow Mahoneys Road east through to the boat ramp carpark located at the very end. |
| Land use |
|
| Land use description | Open space reserve with a thin section of riparian vegetation (consisting mainly of Phragmites) which seperates the river from the large green fields of Deakin University on one side, and an urban residential area on the other. |
| Status | Active |
| Observation history | N/A - 15-03-2024 |
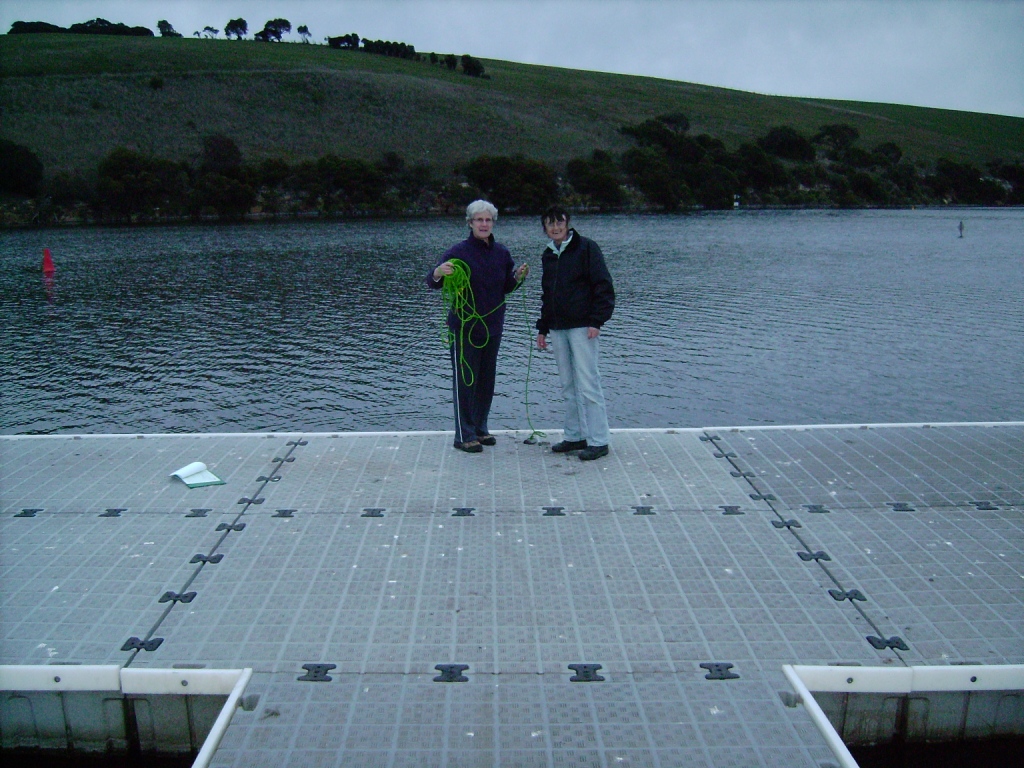
Volunteer at site three. |
|
Observations
Turbidity tubes do not measure below 9 NTU; Chart values of 9 should be interpreted as < 9 NTU
Observations
| Date | 20-05-2023 | 17-06-2023 | 14-07-2023 | 20-08-2023 | 16-09-2023 | 20-10-2023 | 17-11-2023 | 15-12-2023 | 19-01-2024 | 16-02-2024 | 15-03-2024 |
|---|---|---|---|---|---|---|---|---|---|---|---|
| Observation | #15545 | #15586 | #15708 | #15714 | #15753 | #15815 | #15875 | #15919 | #15985 | #16018 | #16056 |
Observation summaries
Turbidity NTU
| 20-05-2023 | 17-06-2023 | 14-07-2023 | 20-08-2023 | 16-09-2023 | 20-10-2023 | 17-11-2023 | 15-12-2023 | 19-01-2024 | 16-02-2024 | 15-03-2024 | |
|---|---|---|---|---|---|---|---|---|---|---|---|
| Top | 11.0 | 12.0 | 30.0 | 19.0 | 14.0 | 24.0 | 9.0 | 14.5 | 9.0 | 12.0 | 15.0 |
| Bottom | 12.0 | 10.0 | 29.5 | 14.0 | 13.0 | 23.0 | 13.0 | 13.8 | 14.0 | 27.0 | 25.0 |
pH
| 20-05-2023 | 17-06-2023 | 14-07-2023 | 20-08-2023 | 16-09-2023 | 20-10-2023 | 17-11-2023 | 15-12-2023 | 19-01-2024 | 16-02-2024 | 15-03-2024 | |
|---|---|---|---|---|---|---|---|---|---|---|---|
| Top | 8.4 | 8.0 | 8.0 | 8.7 | 8.9 | 8.2 | 8.4 | 8.1 | 8.4 | 7.0 | 7.9 |
| Bottom | 8.0 | 7.4 | 8.1 | 8.0 | 8.8 | 8.3 | 8.5 | 8.0 | 8.3 | 7.0 | 8.0 |
Ammonia mg/L
| 20-05-2023 | 17-06-2023 | 14-07-2023 | 20-08-2023 | 16-09-2023 | 20-10-2023 | 17-11-2023 | 15-12-2023 | 19-01-2024 | 16-02-2024 | 15-03-2024 | |
|---|---|---|---|---|---|---|---|---|---|---|---|
| Top | |||||||||||
| Bottom |
Enterococci orgs/100mL
| 20-05-2023 | 17-06-2023 | 14-07-2023 | 20-08-2023 | 16-09-2023 | 20-10-2023 | 17-11-2023 | 15-12-2023 | 19-01-2024 | 16-02-2024 | 15-03-2024 | |
|---|---|---|---|---|---|---|---|---|---|---|---|
| Top | |||||||||||
| Bottom |
Temperature ° C
| 20-05-2023 | 17-06-2023 | 14-07-2023 | 20-08-2023 | 16-09-2023 | 20-10-2023 | 17-11-2023 | 15-12-2023 | 19-01-2024 | 16-02-2024 | 15-03-2024 | |
|---|---|---|---|---|---|---|---|---|---|---|---|
| Top | 12.90 | 11.30 | 11.20 | 13.50 | 16.30 | 23.40 | 20.40 | 21.30 | 22.50 | 23.60 | 21.30 |
| Bottom | 15.80 | 13.80 | 11.20 | 13.30 | 15.60 | 19.50 | 20.20 | 21.40 | 21.50 | 23.50 | 21.00 |
Salinity ppt
| 20-05-2023 | 17-06-2023 | 14-07-2023 | 20-08-2023 | 16-09-2023 | 20-10-2023 | 17-11-2023 | 15-12-2023 | 19-01-2024 | 16-02-2024 | 15-03-2024 | |
|---|---|---|---|---|---|---|---|---|---|---|---|
| Top | 8.10 | 4.10 | 1.50 | 2.50 | 18.40 | 7.00 | 13.30 | 19.90 | 15.10 | 20.10 | 19.50 |
| Bottom | 32.10 | 26.00 | 1.60 | 3.10 | 19.30 | 22.30 | 13.70 | 20.00 | 18.40 | 20.50 | 19.60 |
D.O. mg/L
| 20-05-2023 | 17-06-2023 | 14-07-2023 | 20-08-2023 | 16-09-2023 | 20-10-2023 | 17-11-2023 | 15-12-2023 | 19-01-2024 | 16-02-2024 | 15-03-2024 | |
|---|---|---|---|---|---|---|---|---|---|---|---|
| Top | 11.82 | 9.87 | 10.90 | 12.28 | 11.38 | 16.54 | 9.50 | 7.87 | 8.87 | 8.05 | 7.14 |
| Bottom | 6.30 | 1.55 | 10.34 | 9.31 | 10.80 | 11.22 | 9.80 | 7.95 | 8.41 | 7.97 | 6.61 |
D.O. % Sat
| 20-05-2023 | 17-06-2023 | 14-07-2023 | 20-08-2023 | 16-09-2023 | 20-10-2023 | 17-11-2023 | 15-12-2023 | 19-01-2024 | 16-02-2024 | 15-03-2024 | |
|---|---|---|---|---|---|---|---|---|---|---|---|
| Top | 117.50 | 93.20 | 100.20 | 119.60 | 129.20 | 204.00 | 114.30 | 100.30 | 111.50 | 105.00 | 89.80 |
| Bottom | 77.20 | 17.60 | 95.00 | 86.30 | 121.40 | 138.60 | 117.50 | 101.30 | 104.90 | 104.60 | 82.80 |
Conductivity mS/cm
| 20-05-2023 | 17-06-2023 | 14-07-2023 | 20-08-2023 | 16-09-2023 | 20-10-2023 | 17-11-2023 | 15-12-2023 | 19-01-2024 | 16-02-2024 | 15-03-2024 | |
|---|---|---|---|---|---|---|---|---|---|---|---|
| Top | 13.99 | 7.44 | 2.94 | 4.70 | 29.62 | 12.33 | 21.90 | 31.77 | 24.72 | 32.28 | 31.24 |
| Bottom | 48.87 | 39.91 | 2.97 | 5.70 | 31.20 | 35.07 | 22.70 | 31.97 | 29.55 | 32.72 | 31.45 |

All content, files, data and images provided by the EstuaryWatch Data Portal and Gallery are subject to a Creative Commons Attribution License
Content is made available to be used in any way, and should always attribute EstuaryWatch and www.estuarywatch.org.au