EstuaryWatch Data Portal
B1 The Heads
Active Physico-Chemical 09-11-2007 - 15-05-2024Barwon River Estuary
| ID | Date | Status | Details | ||||||||||||||||||||||||||
|---|---|---|---|---|---|---|---|---|---|---|---|---|---|---|---|---|---|---|---|---|---|---|---|---|---|---|---|---|---|
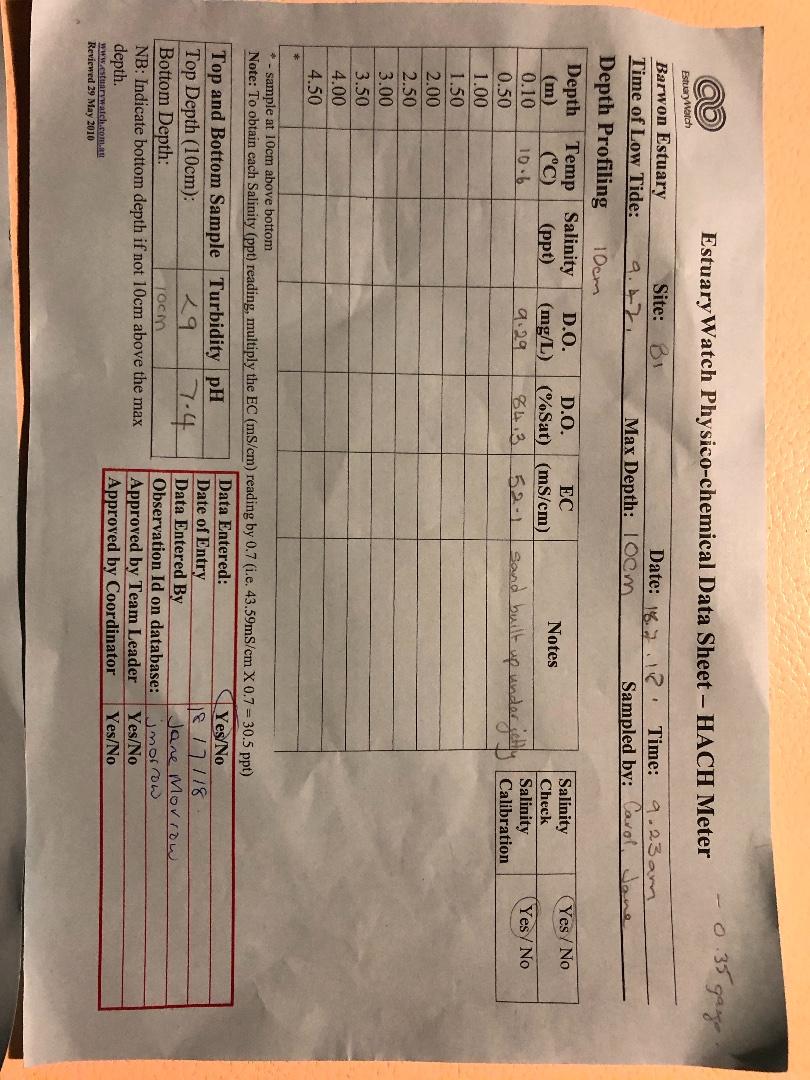
| #12267 | 18 Jul 2018 | Approved |
 |
||||||||||||||||||||||||||
|
|||||||||||||||||||||||||||||
| #12238 | 5 Jul 2018 | Approved |
Notes:
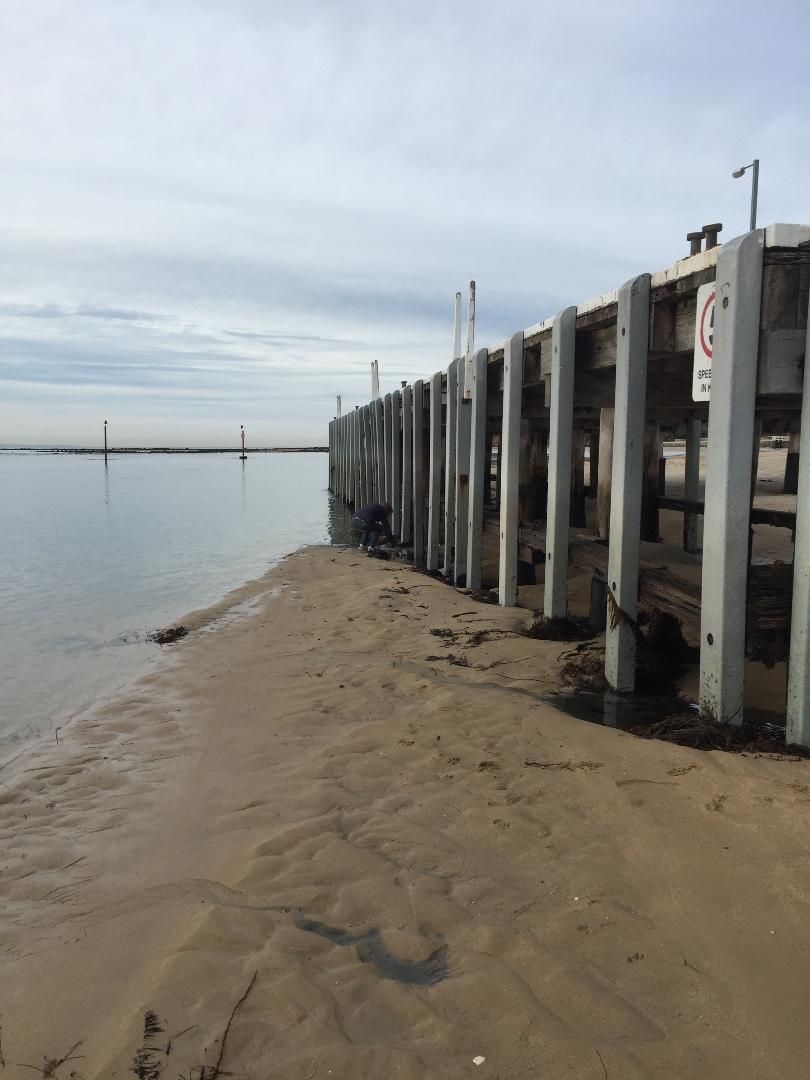
Water Level: Gauge board was in the sand at -0.4m ie "land-locked" Strong current. Readings taken at SE corner of jetty |
||||||||||||||||||||||||||
|
|||||||||||||||||||||||||||||
| #12252 | 20 Jun 2018 | Approved |
Notes:
Pier surrounded by sand. |
||||||||||||||||||||||||||
|
|||||||||||||||||||||||||||||
| #12120 | 7 Jun 2018 | Approved |
Notes:
Sampled at SE corner of jetty. Normal sampling location dry. |
||||||||||||||||||||||||||
|
|||||||||||||||||||||||||||||
| #12050 | 16 May 2018 | Approved |
Notes:
Authorities moved sand from roadway and pedestrian bridge on Monday. Large drifts had built up over these thoroughfares due to high winds last Thursday and Friday. |
||||||||||||||||||||||||||
|
|||||||||||||||||||||||||||||
| #12011 | 3 May 2018 | Approved |
|
||||||||||||||||||||||||||
|
|||||||||||||||||||||||||||||
| #11974 | 18 Apr 2018 | Approved |
Notes:
DO (mg/L) and EC entered in incorrect columns on data sheet |
||||||||||||||||||||||||||
|
|||||||||||||||||||||||||||||
| #11938 | 5 Apr 2018 | Approved |
Notes:
Measurements recorded form southern end of jetty. Current too strong for use of the van Doorn. Water level below bottom of gauge board. Estimate -0.6m |
||||||||||||||||||||||||||
|
|||||||||||||||||||||||||||||
| #11917 | 23 Mar 2018 | Approved |
Notes:
Tide was low and water was running quickly. It was not practical to use the Van Dorn for bottom depth analysis. Early attempts resulted in Van Dorn wrapped around pylon and seaweed at end of pier made alternative site problematic. |
||||||||||||||||||||||||||
|
|||||||||||||||||||||||||||||
| #11841 | 1 Mar 2018 | Approved |
|
||||||||||||||||||||||||||
|
|||||||||||||||||||||||||||||

All content, files, data and images provided by the EstuaryWatch Data Portal and Gallery are subject to a Creative Commons Attribution License
Content is made available to be used in any way, and should always attribute EstuaryWatch and www.estuarywatch.org.au