| #12744
|
7 Mar 2019
|
Approved |
|
|
Depth
|
Turb NTU
|
pH
|
Temp ° C
|
Salin ppt
|
D.O. mg/L
|
D.O. % sat
|
EC mS/cm
|
|
0.1m
|
9.0 |
7.9 |
17.10 |
39.80 |
9.47 |
97.5 |
56.80 |
|
0.8m
|
9.0 |
7.4 |
17.20 |
39.70 |
9.19 |
95.1 |
56.70 |
|
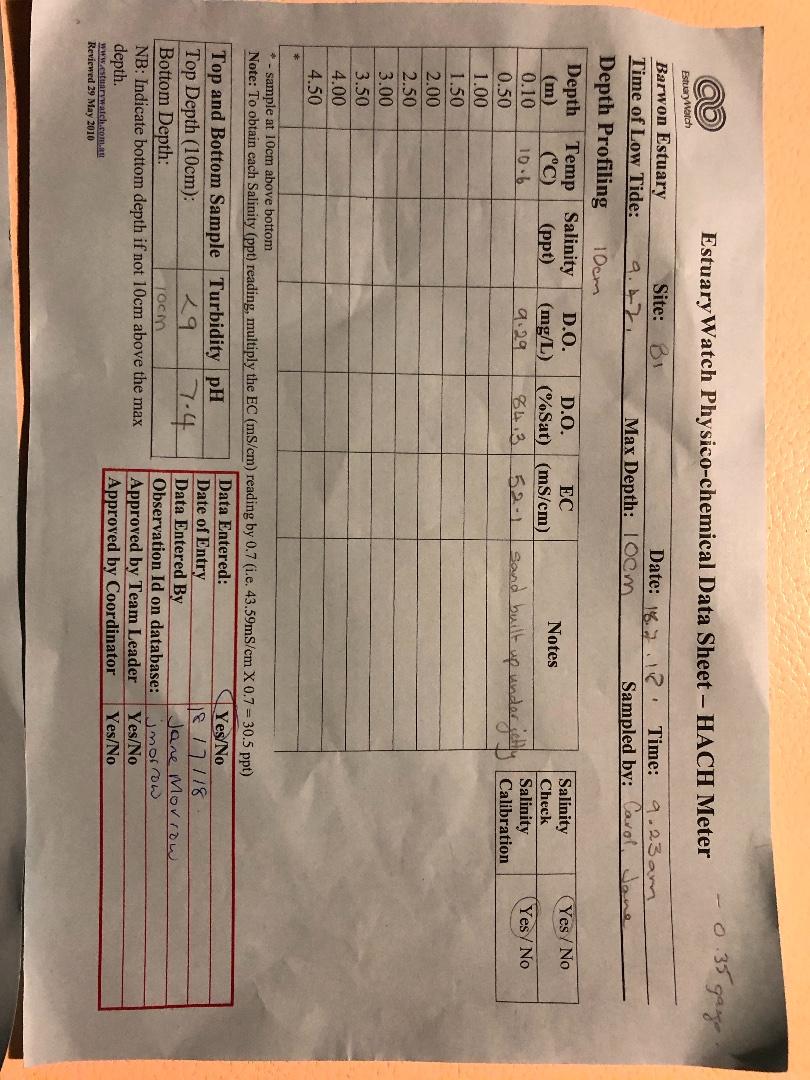
| #12712
|
20 Feb 2019
|
Approved |
Notes:
We decided to record the time of the lower tide for 24 hours and will attempt to be consistent. Not sure which of the low tides other groups record?
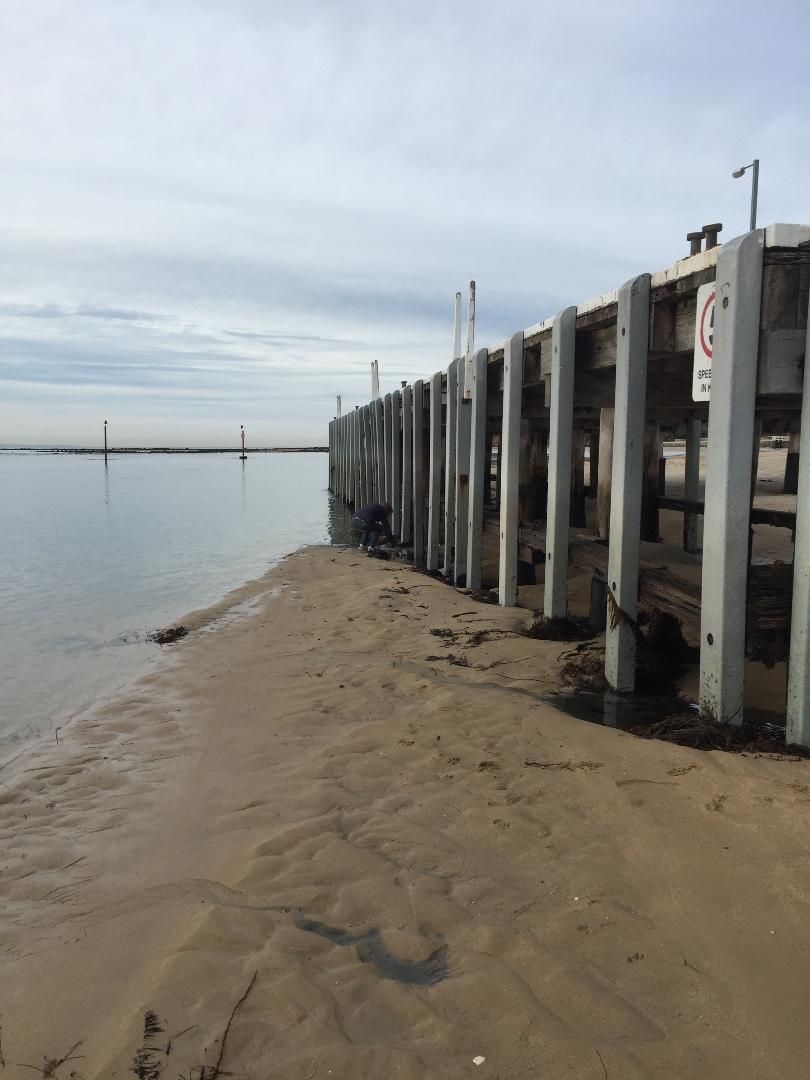
There were occasional flecks of white foam coming from under the pier. Around six anglers were on the pier and one had a cray pot with chicken carcass in it so that may have had something to do with the foam.
Two of the folders are falling apart.
Can the large plastic container in the cupboard be labelled? We assume that it is distilled water, not KCl. Please confirm.
|
|
Depth
|
Turb NTU
|
pH
|
Temp ° C
|
Salin ppt
|
D.O. mg/L
|
D.O. % sat
|
EC mS/cm
|
|
0.1m
|
9.0 |
7.5 |
18.80 |
39.50 |
9.13 |
98.4 |
56.40 |
|
1.2m
|
9.0 |
7.8 |
18.90 |
39.40 |
8.98 |
97.2 |
56.30 |
|
| #12684
|
7 Feb 2019
|
Approved |
|
|
Depth
|
Turb NTU
|
pH
|
Temp ° C
|
Salin ppt
|
D.O. mg/L
|
D.O. % sat
|
EC mS/cm
|
|
0.1m
|
9.0 |
7.7 |
21.10 |
38.80 |
6.82 |
77.5 |
55.40 |
|
1.4m
|
9.0 |
7.7 |
21.10 |
38.80 |
6.71 |
76.2 |
55.40 |
|
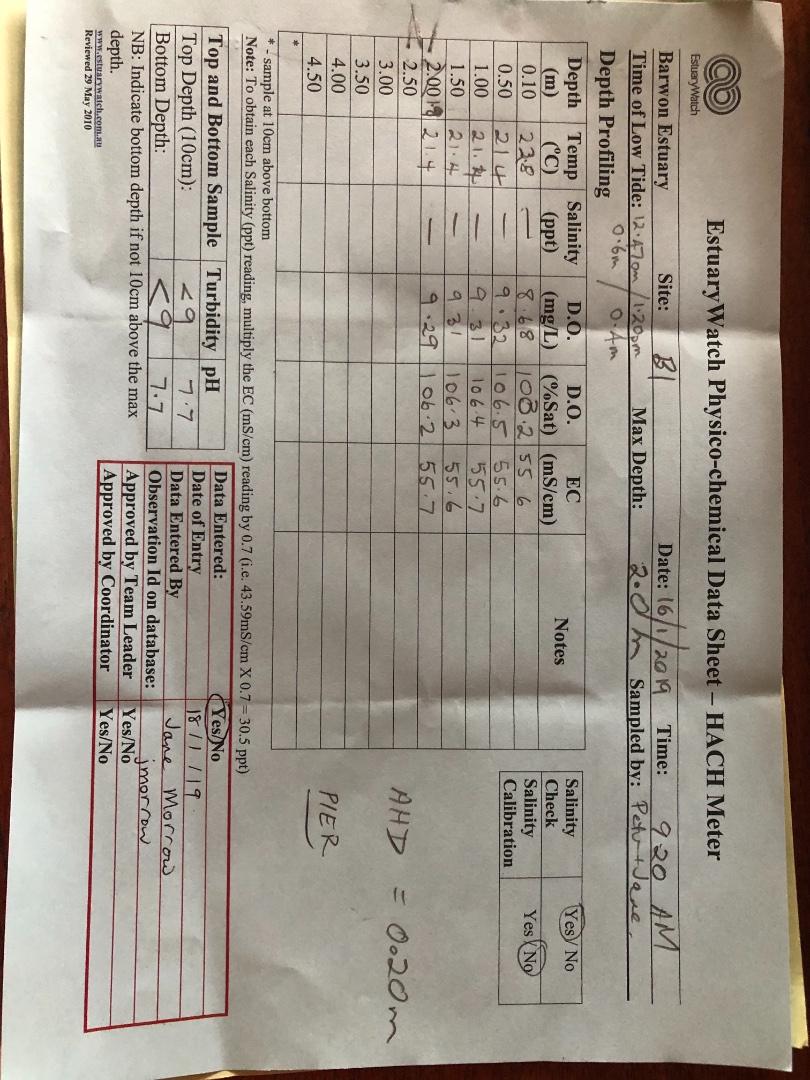
| #12651
|
16 Jan 2019
|
Approved |
|
|
Depth
|
Turb NTU
|
pH
|
Temp ° C
|
Salin ppt
|
D.O. mg/L
|
D.O. % sat
|
EC mS/cm
|
|
0.1m
|
9.0 |
7.7 |
22.80 |
38.90 |
8.68 |
103.2 |
55.60 |
|
1.9m
|
9.0 |
7.7 |
21.40 |
39.00 |
9.29 |
106.2 |
55.70 |
|
| #12614
|
3 Jan 2019
|
Approved |
|
|
Depth
|
Turb NTU
|
pH
|
Temp ° C
|
Salin ppt
|
D.O. mg/L
|
D.O. % sat
|
EC mS/cm
|
|
0.1m
|
9.0 |
7.8 |
20.20 |
38.60 |
9.69 |
107.8 |
55.10 |
|
2.5m
|
9.0 |
7.8 |
19.90 |
38.60 |
9.65 |
106.6 |
55.10 |
|
| #12622
|
19 Dec 2018
|
Approved |
|
|
Depth
|
Turb NTU
|
pH
|
Temp ° C
|
Salin ppt
|
D.O. mg/L
|
D.O. % sat
|
EC mS/cm
|
|
0.1m
|
9.0 |
7.8 |
19.90 |
37.40 |
9.89 |
109.7 |
53.40 |
|
1.9m
|
9.0 |
7.7 |
19.70 |
37.50 |
9.93 |
109.3 |
53.60 |
|
| #12573
|
6 Dec 2018
|
Approved |
|
|
Depth
|
Turb NTU
|
pH
|
Temp ° C
|
Salin ppt
|
D.O. mg/L
|
D.O. % sat
|
EC mS/cm
|
|
0.1m
|
9.0 |
7.8 |
18.50 |
37.20 |
9.96 |
106.8 |
53.20 |
|
1.9m
|
9.0 |
7.9 |
18.10 |
37.90 |
10.19 |
108.2 |
54.10 |
|
| #12542
|
21 Nov 2018
|
Approved |
|
|
Depth
|
Turb NTU
|
pH
|
Temp ° C
|
Salin ppt
|
D.O. mg/L
|
D.O. % sat
|
EC mS/cm
|
|
0.1m
|
8.0 |
7.8 |
16.00 |
38.60 |
9.50 |
98.3 |
55.20 |
|
1.9m
|
8.0 |
7.9 |
15.90 |
38.60 |
9.43 |
97.4 |
55.20 |
|
| #12478
|
1 Nov 2018
|
Approved |
Notes:
Tidal outflow too rapid to use van Doorn at side of jetty and water shallow there too, hence, readings taken at south end of jetty where van Doorn functioned satisfactorily despite the flow and where the water was deeper.
|
|
Depth
|
Turb NTU
|
pH
|
Temp ° C
|
Salin ppt
|
D.O. mg/L
|
D.O. % sat
|
EC mS/cm
|
|
0.1m
|
9.0 |
7.9 |
15.80 |
38.60 |
9.13 |
92.5 |
55.10 |
|
2.0m
|
9.0 |
7.9 |
15.70 |
38.60 |
9.11 |
92.0 |
55.10 |
|
| #12456
|
17 Oct 2018
|
Approved |
Notes:
NB. The van Loon meter only reached to 1.5m(ie it couldnt reach the bottom) due to the fast ebbing current.
|
|
Depth
|
Turb NTU
|
pH
|
Temp ° C
|
Salin ppt
|
D.O. mg/L
|
D.O. % sat
|
EC mS/cm
|
|
0.1m
|
8.0 |
7.9 |
15.60 |
38.40 |
9.37 |
94.5 |
54.80 |
|
1.9m
|
8.0 |
7.8 |
15.50 |
38.50 |
9.44 |
95.4 |
55.00 |
|
| #12433
|
4 Oct 2018
|
Approved |
Notes:
Readings done from southern end of jetty, since water very shallow at side.
Bottom uneven - measured depth 2.4m, but weight on probe touched bottom at 2.0m
|
|
Depth
|
Turb NTU
|
pH
|
Temp ° C
|
Salin ppt
|
D.O. mg/L
|
D.O. % sat
|
EC mS/cm
|
|
0.1m
|
9.0 |
7.7 |
13.30 |
38.60 |
10.14 |
96.9 |
55.10 |
|
2.0m
|
9.0 |
7.7 |
13.20 |
38.60 |
10.17 |
96.6 |
55.20 |
|
| #12408
|
19 Sep 2018
|
Approved |
Notes:
Turbidity reading for both depths less than 9.
Tide flowing out really strongly.
|
|
Depth
|
Turb NTU
|
pH
|
Temp ° C
|
Salin ppt
|
D.O. mg/L
|
D.O. % sat
|
EC mS/cm
|
|
0.1m
|
8.0 |
7.7 |
12.80 |
38.60 |
10.50 |
99.8 |
55.10 |
|
0.9m
|
8.0 |
7.8 |
12.80 |
38.60 |
10.49 |
99.8 |
55.10 |
|
| #12375
|
6 Sep 2018
|
Approved |
|
|
Depth
|
Turb NTU
|
pH
|
Temp ° C
|
Salin ppt
|
D.O. mg/L
|
D.O. % sat
|
EC mS/cm
|
|
0.1m
|
9.0 |
7.7 |
13.00 |
37.80 |
9.66 |
93.1 |
54.00 |
|
1.0m
|
9.0 |
7.8 |
12.80 |
37.90 |
9.78 |
93.3 |
54.20 |
|
| #12331
|
15 Aug 2018
|
Approved |
Notes:
Only one reading was taken for turbidity and pH as it was difficult to launch the Van Dorn due to high winds and fast flowing water.
|
|
Depth
|
Turb NTU
|
pH
|
Temp ° C
|
Salin ppt
|
D.O. mg/L
|
D.O. % sat
|
EC mS/cm
|
|
0.1m
|
16.0 |
7.5 |
11.90 |
28.90 |
9.63 |
90.7 |
41.30 |
|
0.3m
|
16.0 |
7.5 |
11.70 |
28.90 |
9.68 |
90.7 |
41.30 |
|
| #12302
|
2 Aug 2018
|
Approved |
Notes:
Bottom of gaugeboard in seaweed.
Water very shallow at usual B1 site. Monitored from southern end of jetty.
Very windy surface water turbulent
|
|
Depth
|
Turb NTU
|
pH
|
Temp ° C
|
Salin ppt
|
D.O. mg/L
|
D.O. % sat
|
EC mS/cm
|
|
0.1m
|
9.0 |
7.8 |
10.40 |
24.10 |
10.04 |
90.0 |
34.40 |
|
1.5m
|
9.0 |
7.7 |
10.10 |
24.10 |
10.09 |
89.7 |
34.40 |
|
| #12267
|
18 Jul 2018
|
Approved |
|
|
Depth
|
Turb NTU
|
pH
|
Temp ° C
|
Salin ppt
|
D.O. mg/L
|
D.O. % sat
|
EC mS/cm
|
|
0.1m
|
9.0 |
7.4 |
10.40 |
24.10 |
10.04 |
90.0 |
34.40 |
|
1.5m
|
9.0 |
|
10.10 |
24.10 |
10.09 |
89.7 |
34.40 |
|
| #12238
|
5 Jul 2018
|
Approved |
Notes:
Water Level: Gauge board was in the sand at -0.4m ie "land-locked"
Strong current. Readings taken at SE corner of jetty
|
|
Depth
|
Turb NTU
|
pH
|
Temp ° C
|
Salin ppt
|
D.O. mg/L
|
D.O. % sat
|
EC mS/cm
|
|
0.1m
|
9.0 |
7.6 |
11.70 |
36.80 |
8.94 |
83.4 |
52.60 |
|
1.5m
|
9.0 |
7.9 |
11.50 |
37.00 |
8.95 |
82.9 |
52.80 |
|
| #12252
|
20 Jun 2018
|
Approved |
Notes:
Pier surrounded by sand.
|
|
Depth
|
Turb NTU
|
pH
|
Temp ° C
|
Salin ppt
|
D.O. mg/L
|
D.O. % sat
|
EC mS/cm
|
|
0.1m
|
25.0 |
6.5 |
11.70 |
36.80 |
8.94 |
83.4 |
52.60 |
|
1.5m
|
25.0 |
7.5 |
11.50 |
37.00 |
8.95 |
82.9 |
52.80 |
|
| #12120
|
7 Jun 2018
|
Approved |
Notes:
Sampled at SE corner of jetty. Normal sampling location dry.
|
|
Depth
|
Turb NTU
|
pH
|
Temp ° C
|
Salin ppt
|
D.O. mg/L
|
D.O. % sat
|
EC mS/cm
|
|
0.1m
|
9.0 |
7.8 |
12.60 |
36.70 |
9.62 |
90.7 |
52.40 |
|
1.0m
|
9.0 |
7.6 |
12.40 |
37.40 |
9.62 |
89.9 |
53.40 |
|
| #12050
|
16 May 2018
|
Approved |
Notes:
Authorities moved sand from roadway and pedestrian bridge on Monday. Large drifts had built up over these thoroughfares due to high winds last Thursday and Friday.
|
|
Depth
|
Turb NTU
|
pH
|
Temp ° C
|
Salin ppt
|
D.O. mg/L
|
D.O. % sat
|
EC mS/cm
|
|
0.1m
|
9.0 |
7.7 |
13.70 |
38.40 |
9.61 |
92.0 |
54.90 |
|
1.4m
|
9.0 |
7.8 |
13.60 |
38.40 |
9.62 |
91.5 |
54.90 |
|
| #12011
|
3 May 2018
|
Approved |
|
|
Depth
|
Turb NTU
|
pH
|
Temp ° C
|
Salin ppt
|
D.O. mg/L
|
D.O. % sat
|
EC mS/cm
|
|
0.1m
|
9.0 |
7.8 |
15.80 |
38.80 |
8.74 |
89.7 |
55.50 |
|
1.3m
|
9.0 |
7.8 |
15.60 |
38.90 |
8.68 |
88.0 |
55.60 |
|
| #11974
|
18 Apr 2018
|
Approved |
Notes:
DO (mg/L) and EC entered in incorrect columns on data sheet
|
|
Depth
|
Turb NTU
|
pH
|
Temp ° C
|
Salin ppt
|
D.O. mg/L
|
D.O. % sat
|
EC mS/cm
|
|
0.1m
|
11.5 |
7.6 |
15.00 |
38.60 |
8.25 |
81.8 |
55.10 |
|
1.5m
|
11.5 |
7.7 |
14.80 |
38.60 |
8.26 |
81.3 |
55.10 |
|
| #11938
|
5 Apr 2018
|
Approved |
Notes:
Measurements recorded form southern end of jetty. Current too strong for use of the van Doorn.
Water level below bottom of gauge board. Estimate -0.6m
|
|
Depth
|
Turb NTU
|
pH
|
Temp ° C
|
Salin ppt
|
D.O. mg/L
|
D.O. % sat
|
EC mS/cm
|
|
0.1m
|
9.0 |
7.6 |
18.00 |
38.70 |
7.79 |
82.8 |
55.30 |
|
2.7m
|
9.0 |
7.7 |
17.90 |
38.60 |
7.79 |
82.4 |
55.20 |
|
| #11917
|
23 Mar 2018
|
Approved |
Notes:
Tide was low and water was running quickly. It was not practical to use the Van Dorn for bottom depth analysis. Early attempts resulted in Van Dorn wrapped around pylon and seaweed at end of pier made alternative site problematic.
|
|
Depth
|
Turb NTU
|
pH
|
Temp ° C
|
Salin ppt
|
D.O. mg/L
|
D.O. % sat
|
EC mS/cm
|
|
0.1m
|
9.0 |
7.6 |
18.50 |
38.60 |
7.89 |
84.2 |
55.20 |
|
1.4m
|
9.0 |
|
18.30 |
38.70 |
7.93 |
84.3 |
55.30 |
|
| #11841
|
1 Mar 2018
|
Approved |
|
|
Depth
|
Turb NTU
|
pH
|
Temp ° C
|
Salin ppt
|
D.O. mg/L
|
D.O. % sat
|
EC mS/cm
|
|
0.1m
|
9.0 |
8.0 |
19.30 |
38.40 |
7.92 |
86.4 |
54.80 |
|
2.5m
|
9.0 |
7.8 |
19.10 |
38.40 |
7.93 |
86.0 |
54.90 |
|