EstuaryWatch Data Portal
G2 Old Coach Road Bridge Princetown
Active Physico-Chemical 20-04-2007 - 21-07-2023Gellibrand River Estuary
| ID | Date | Status | Details | ||||||||||||||||||||||||||
|---|---|---|---|---|---|---|---|---|---|---|---|---|---|---|---|---|---|---|---|---|---|---|---|---|---|---|---|---|---|
| #13003 | 21 Dec 2018 | Approved |
Notes:
IEC site Mouth Open 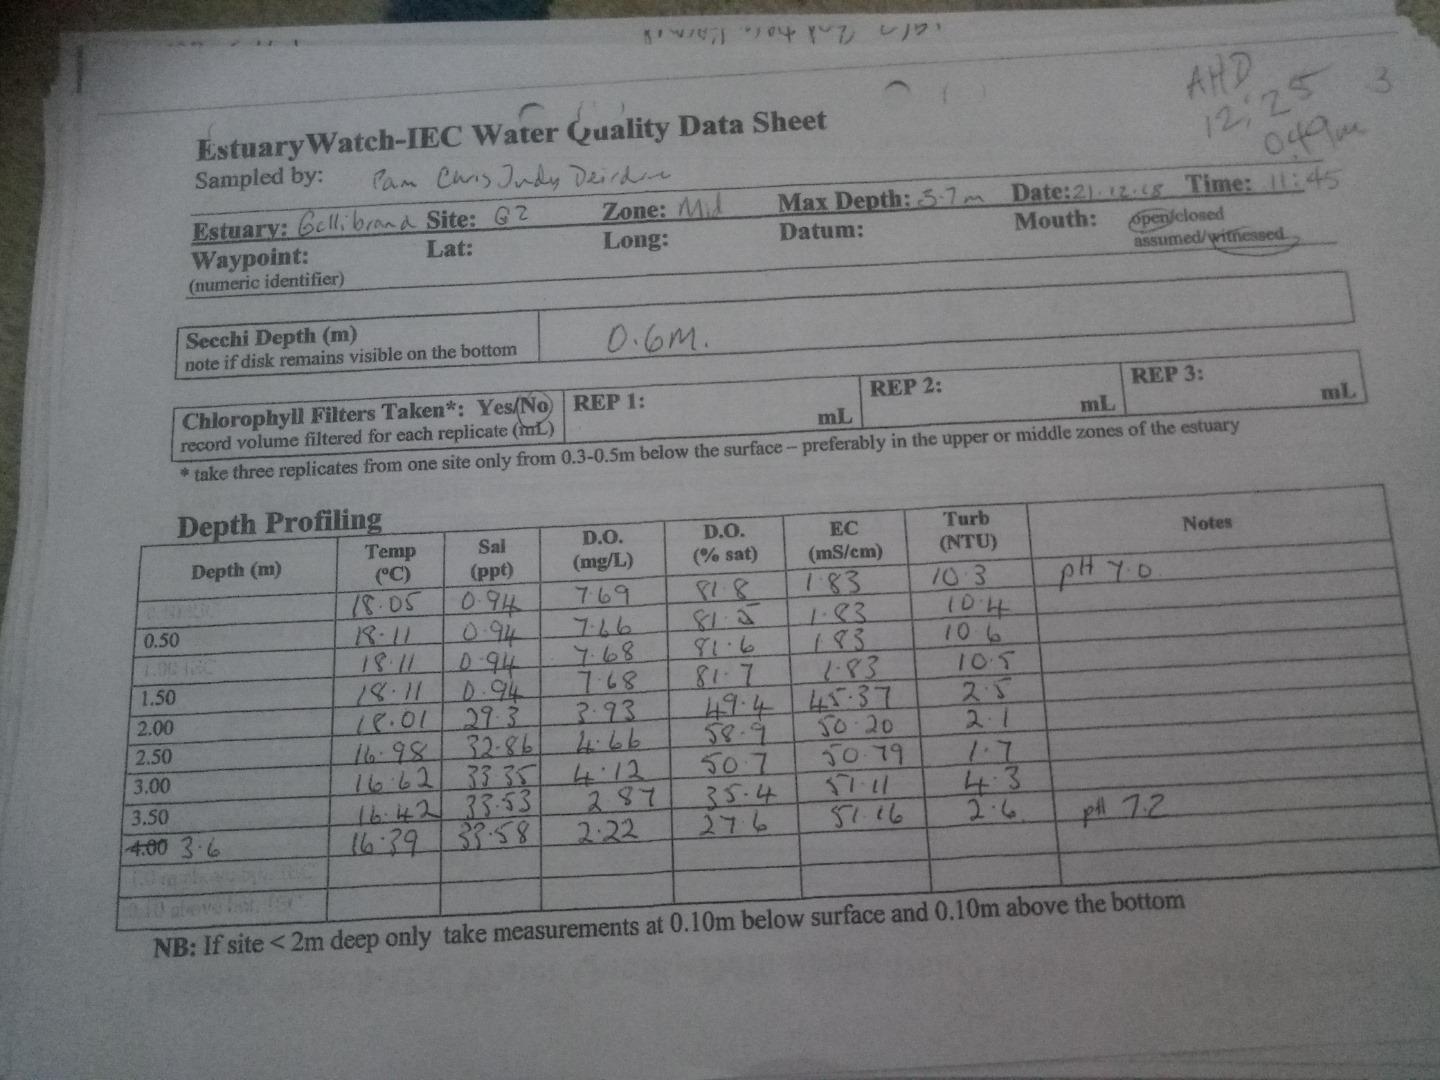 |
||||||||||||||||||||||||||
|
|||||||||||||||||||||||||||||
| #12576 | 8 Dec 2018 | Approved |
Notes:
AHD G2 0.56 @ 09:50 G6 0.98 @ 09:40 SE Wind bringing waves to G2 making flow estimate very difficult After a short duration closure the mouth opened naturally on 06-12-18, 40C. heat on 07-12-18. Low water level in estuary with sand bar partially exposed & drying algae draped over veg. at E side of estuary. Waves entering shallow over wide area / dense sea mist & air temp about 18C. |
||||||||||||||||||||||||||
|
|||||||||||||||||||||||||||||
| #13002 | 23 Nov 2018 | Approved |
Notes:
IEC Site. Mouth Open. 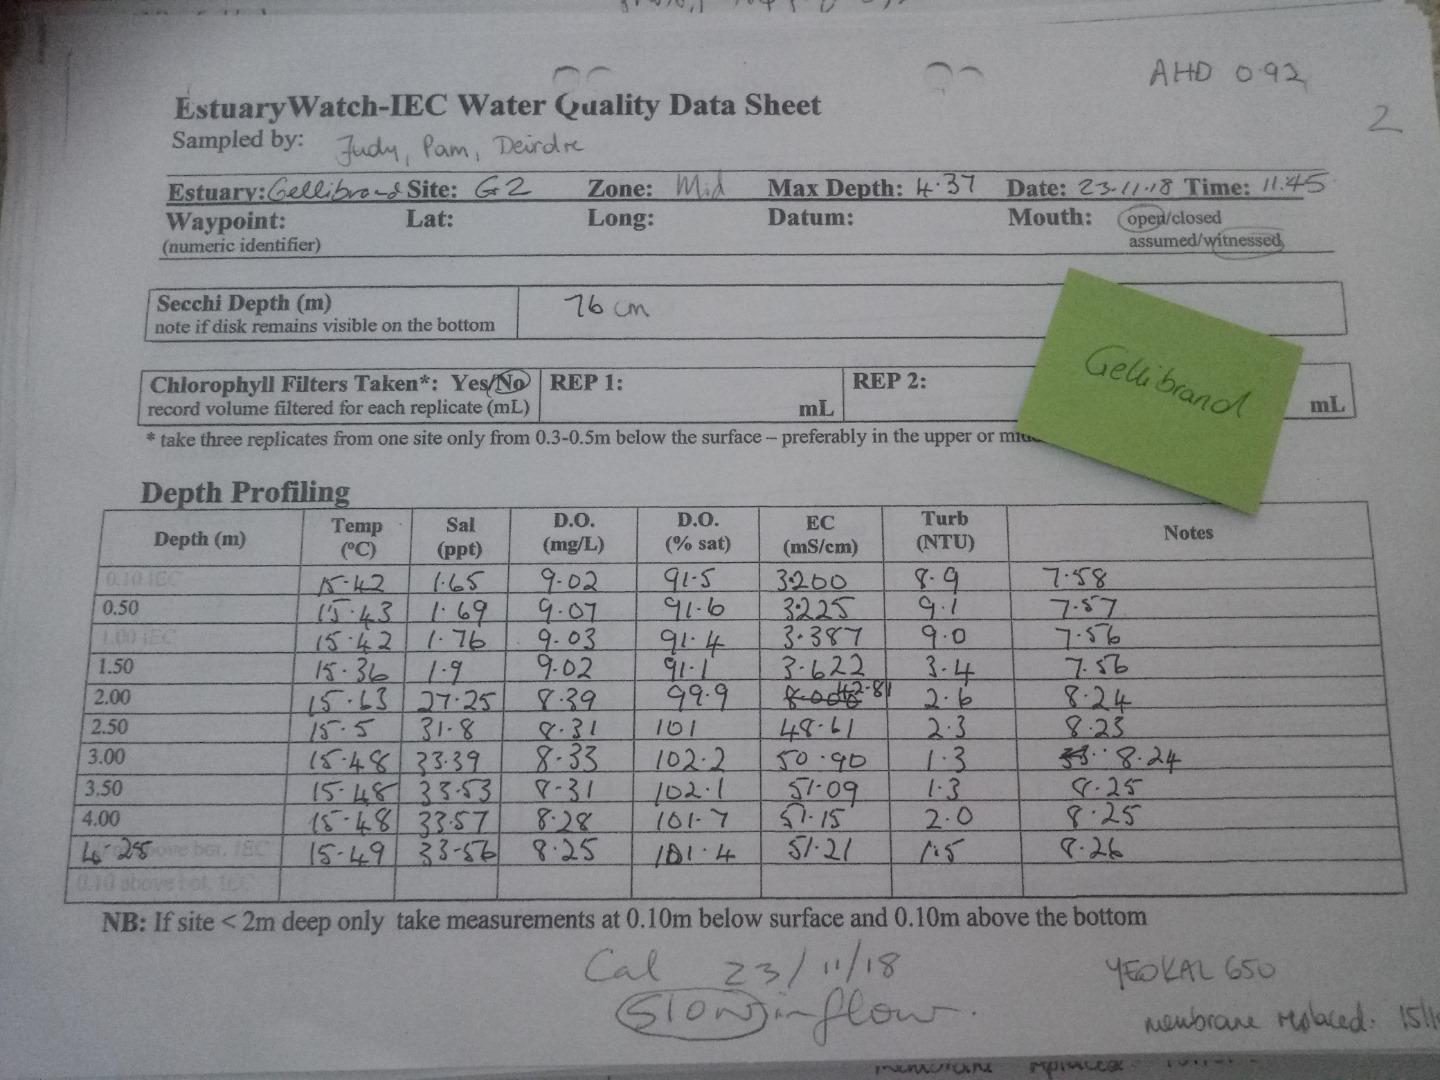 |
||||||||||||||||||||||||||
|
|||||||||||||||||||||||||||||
| #12538 | 16 Nov 2018 | Approved |
Notes:
AHD 0.58 Large amount of silt settling rapidly in turbidity / pH sample |
||||||||||||||||||||||||||
|
|||||||||||||||||||||||||||||
| #12528 | 13 Nov 2018 | Approved |
Notes:
AHD G2 0.34 @ 13:00 G6 1.01 @ 11:17 AHD boards partially obscured with silt |
||||||||||||||||||||||||||
|
|||||||||||||||||||||||||||||
| #12526 | 11 Nov 2018 | Approved |
Notes:
AHD G6 1.64 @ 10:54 G2 1.54 @ 10;03 Mouth was actually open during monitoring. Fishermen reported estuary water trickling out at night on 10-11-18 & open am. on 11-11-18. Mouth was perched on 04-11-18, closed on 05-11-18 & opened again on 11-11-18 |
||||||||||||||||||||||||||
|
|||||||||||||||||||||||||||||
| #12452 | 19 Oct 2018 | Approved |
Notes:
No weights were used as flow was not as strong as upstream |
||||||||||||||||||||||||||
|
|||||||||||||||||||||||||||||
| #12405 | 21 Sep 2018 | Approved |
Notes:
AHD G2 0.49 @ 10:23 G6 1.95 @ 08:15 Bearer under bridge fractured 31-08-2018 (bridge closed) repair completed to 15 T load limit on 20-09-18 |
||||||||||||||||||||||||||
|
|||||||||||||||||||||||||||||
| #12340 | 17 Aug 2018 | Approved |
Notes:
AHD G6 over AHD board @ 07:48 G2 0.65 @ 09:35 Turbidity G6 34 NTUs pH 6.8 Very cold North wind 5 Monitoring difficult because of very fast flow. Probe attached to rope with 4 weights. The use of weights raised the height of the probe above 10 cm from the bottom both at G2 & Lt1 The turbidity water sampler was possibly dragged about 5m.downstream in the very fast flow so bottom readings may not be accurate |
||||||||||||||||||||||||||
|
|||||||||||||||||||||||||||||
| #12283 | 21 Jul 2018 | Approved |
Notes:
AHD 0.95 @ 09:23 ( G2 was 1.36 @ 15:00 on 20-07-18) G6 3.03 @ 08:47 Strong tidal influence over night Bottom turbidity sample contained many small particles Flats have drained downstream of G4 but not upstream where deep water cover exists across the flood plain |
||||||||||||||||||||||||||
|
|||||||||||||||||||||||||||||

All content, files, data and images provided by the EstuaryWatch Data Portal and Gallery are subject to a Creative Commons Attribution License
Content is made available to be used in any way, and should always attribute EstuaryWatch and www.estuarywatch.org.au