EstuaryWatch Data Portal
Cu1 Dorey Street floating pontoon
Active Physico-Chemical 11-12-2013 - 07-05-2024Curdies River Estuary
| ID | Date | Status | Details | ||||||||||||||||||||||||||
|---|---|---|---|---|---|---|---|---|---|---|---|---|---|---|---|---|---|---|---|---|---|---|---|---|---|---|---|---|---|
| #15785 | 3 Oct 2023 | Pending |
Notes:
we were unable to measure Temperature, Dissolved Oxygen and Electrical Conductivity because our multi-purpose meter was under repair.
Phosphate reading = Top = 0.07 Bottom = 0.02 Nitrate reading = Top = 10 Bottom = 10 Nitrite reading = Top = 1 Bottom = 1 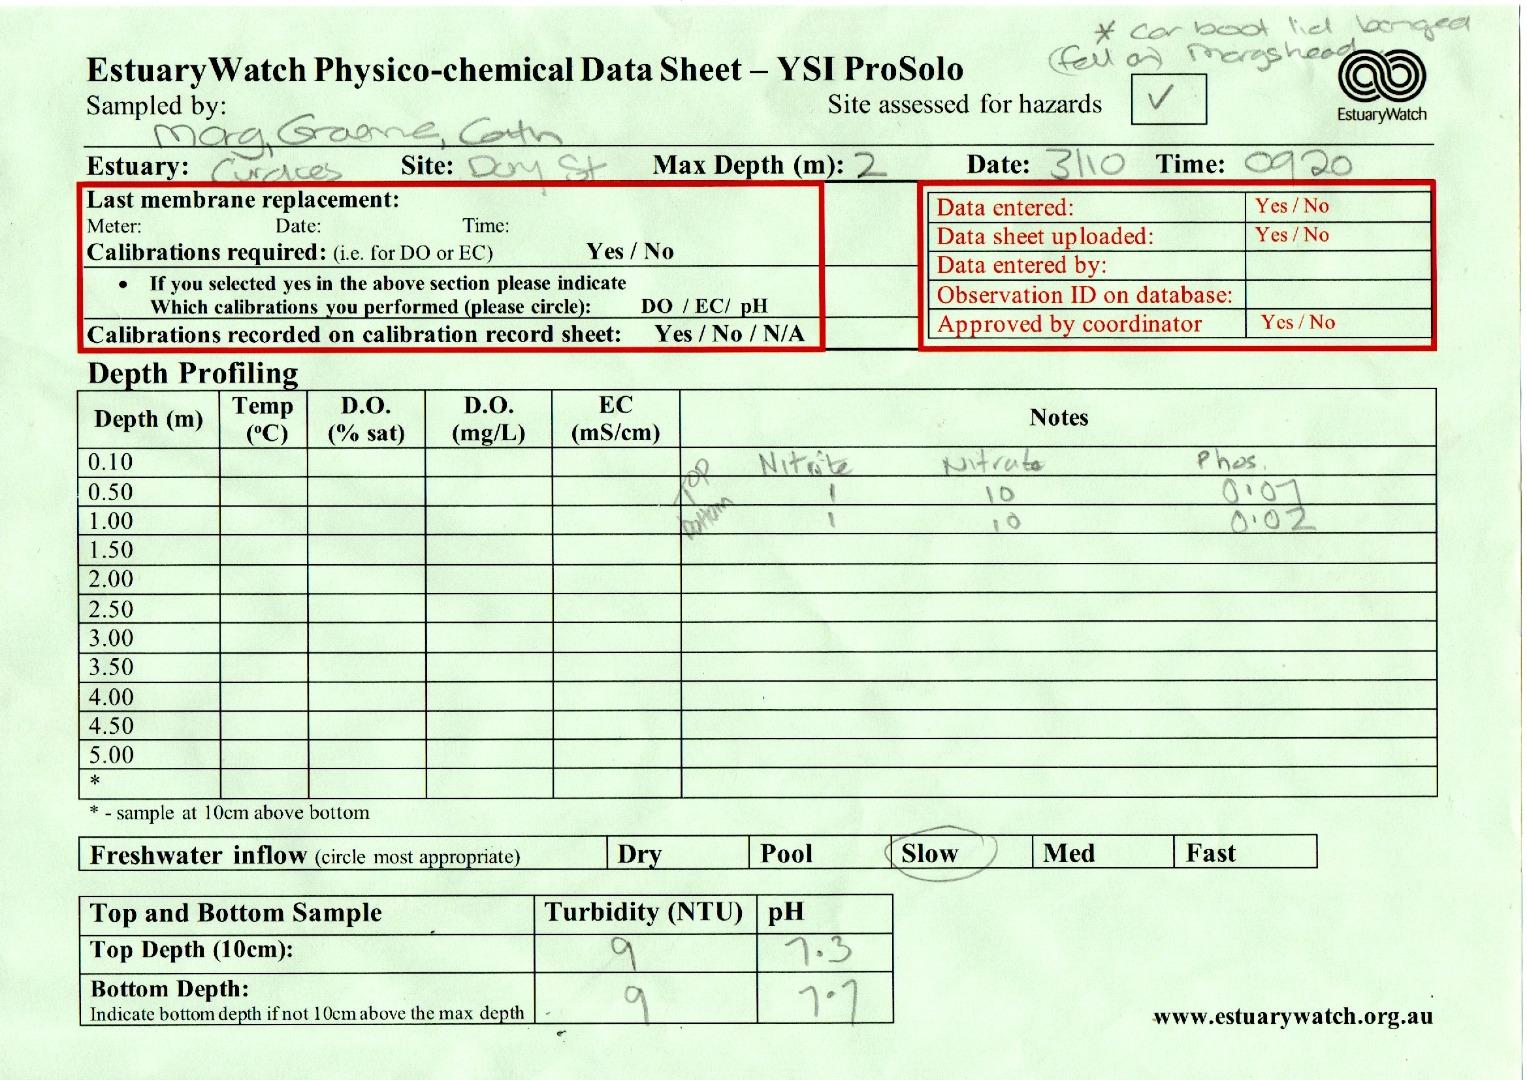 |
||||||||||||||||||||||||||
|
|||||||||||||||||||||||||||||
| #15894 | 5 Dec 2023 | Approved |
Notes:
Nitrite = 0.0 Nitrate = 0.0 Phosphate = 0.05 |
||||||||||||||||||||||||||
|
|||||||||||||||||||||||||||||
| #15943 | 2 Jan 2024 | Approved |
Notes:
Nitrate = 0.0 Nitrite = 0.5 Phosphate = 0.05 |
||||||||||||||||||||||||||
|
|||||||||||||||||||||||||||||
| #15998 | 6 Feb 2024 | Approved |
Notes:
Phosphate = 0.7 Nitrite = 0 Nitrate = 10 |
||||||||||||||||||||||||||
|
|||||||||||||||||||||||||||||
| #16041 | 5 Mar 2024 | Approved |
Notes:
Blue-Green Algae forming on various areas of the lower lake
Phosphate - Unable to determine because of discolouration of the water. Nitrite - 1 Nitrate - 10 |
||||||||||||||||||||||||||
|
|||||||||||||||||||||||||||||
| #16086 | 2 Apr 2024 | Approved |
Notes:
Prolific Blue-Green Algae. Condition of water - dark green and murky, meant that we could not carry out the Phosphate, Nitrate or Nitrate tests.
|
||||||||||||||||||||||||||
|
|||||||||||||||||||||||||||||
| #16155 | 7 May 2024 | Approved |
Notes:
Extensive blue-green algae present Eel fisherman setting eel traps in very polluted water near berm.
Nitrites = 0 Nitrates = 0 Phosphates = 0.07 |
||||||||||||||||||||||||||
|
|||||||||||||||||||||||||||||

All content, files, data and images provided by the EstuaryWatch Data Portal and Gallery are subject to a Creative Commons Attribution License
Content is made available to be used in any way, and should always attribute EstuaryWatch and www.estuarywatch.org.au