EstuaryWatch Data Portal
P4 The Bend
Active Physico-Chemical 19-10-2007 - 14-04-2024Painkalac Creek Estuary
177 results found (Displaying 21 - 30)
| ID | Date | Status | Details | ||||||||||||||||||||||||||
|---|---|---|---|---|---|---|---|---|---|---|---|---|---|---|---|---|---|---|---|---|---|---|---|---|---|---|---|---|---|
| #14562 | 20 Mar 2022 | Approved |
|
||||||||||||||||||||||||||
|
|||||||||||||||||||||||||||||
| #14503 | 12 Feb 2022 | Approved |
|
||||||||||||||||||||||||||
|
|||||||||||||||||||||||||||||
| #14466 | 15 Jan 2022 | Approved |
|
||||||||||||||||||||||||||
|
|||||||||||||||||||||||||||||
| #14425 | 12 Dec 2021 | Approved |
|
||||||||||||||||||||||||||
|
|||||||||||||||||||||||||||||
| #14366 | 13 Nov 2021 | Approved |
Notes:
pH of 4.8 is recorded on the data sheet but its unusual for this site. Not added to record. Monitor again to check for possible activation of acid sulphate soils in the area. Or it could be a typo? |
||||||||||||||||||||||||||
|
|||||||||||||||||||||||||||||
| #14317 | 10 Oct 2021 | Approved |
|
||||||||||||||||||||||||||
|
|||||||||||||||||||||||||||||
| #14279 | 11 Sep 2021 | Approved |
|
||||||||||||||||||||||||||
|
|||||||||||||||||||||||||||||
| #14248 | 15 Aug 2021 | Approved |
Notes:
Water almost at top of jetty and flowing steadily Approximations for percent saturation (using saturation monogram) added for these depths: 0.5m 95% 1.0m 48% 1.5m 28% 1.65m 18% |
||||||||||||||||||||||||||
|
|||||||||||||||||||||||||||||
| #14217 | 11 Jul 2021 | Approved |
Notes:
Conditions very calm |
||||||||||||||||||||||||||
|
|||||||||||||||||||||||||||||
| #14245 | 13 Jun 2021 | Approved |
Notes:
Inlet drained 3 days ago Approximation for DO saturation at 1m is 35% from saturation monogram 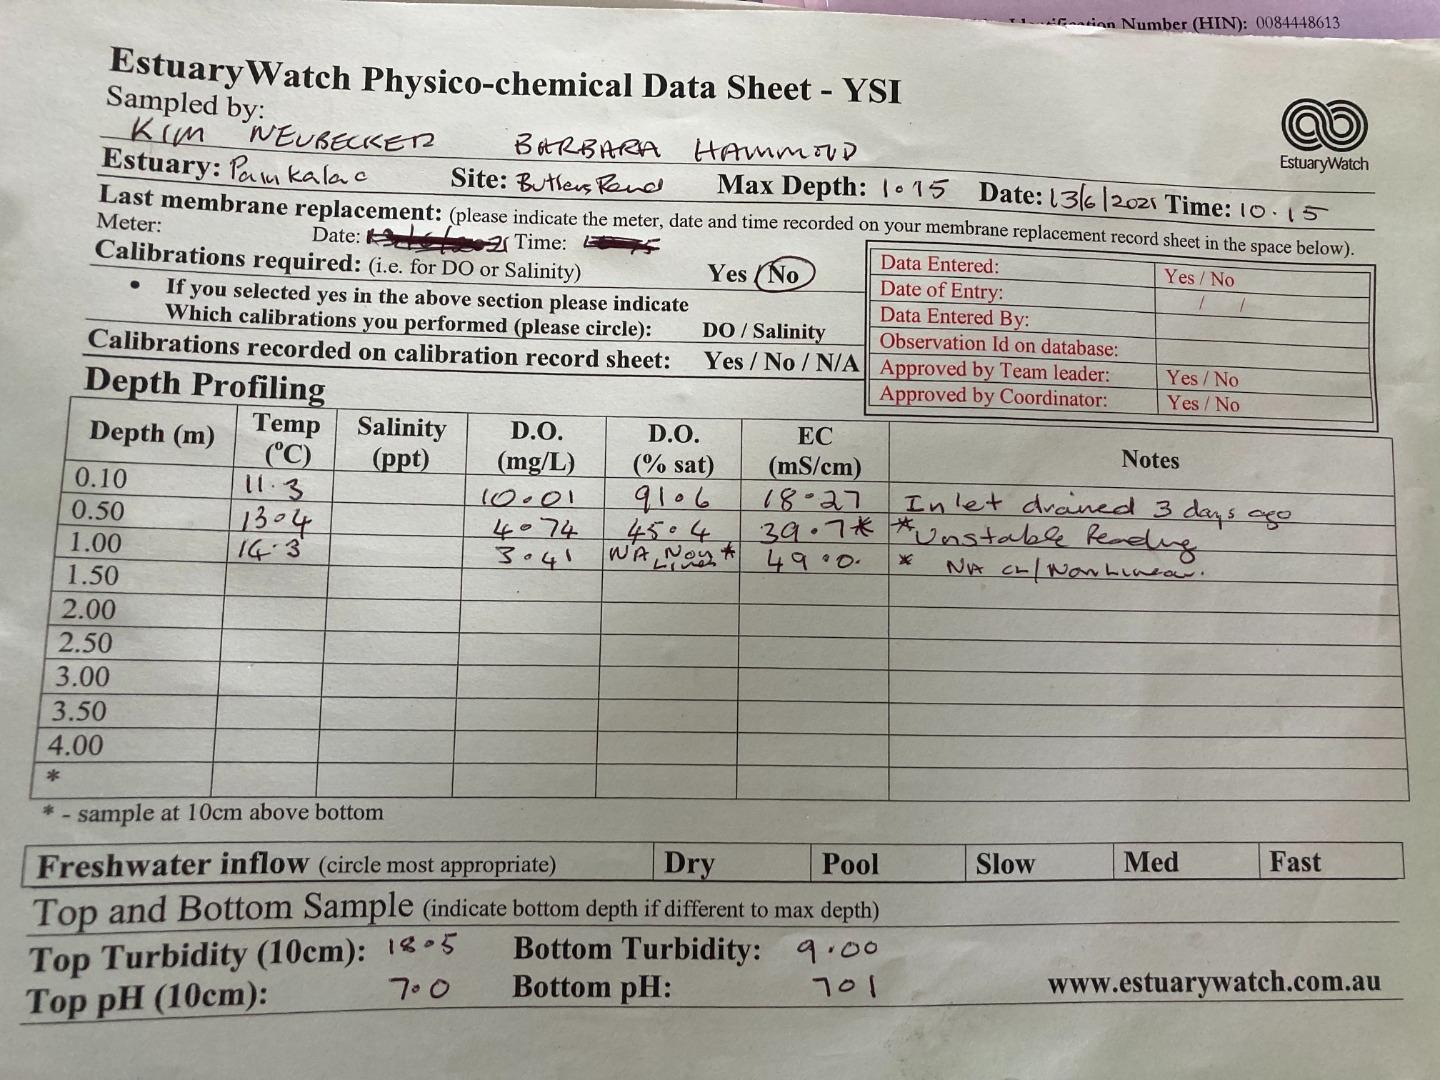 |
||||||||||||||||||||||||||
|
|||||||||||||||||||||||||||||

All content, files, data and images provided by the EstuaryWatch Data Portal and Gallery are subject to a Creative Commons Attribution License
Content is made available to be used in any way, and should always attribute EstuaryWatch and www.estuarywatch.org.au