EstuaryWatch Data Portal
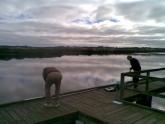
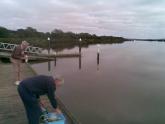
B2 Boat Ramp Jetty
Active Physico-Chemical 20-01-2008 - 02-05-2024Barwon River Estuary
228 results found (Displaying 31 - 40)
| ID | Date | Status | Details | ||||||||||||||||||||||||||
|---|---|---|---|---|---|---|---|---|---|---|---|---|---|---|---|---|---|---|---|---|---|---|---|---|---|---|---|---|---|
| #4562 | 10 Sep 2010 | Approved |
Notes:
Trouble getting hach machine to stabilise I think the fast flow and the turbity/freshwater flow had some effect too great for machine to cope with. Hence the lack of complete data in above form. same as last month. even muddier , cloudy, stiff breeze, one white heron |
||||||||||||||||||||||||||
|
|||||||||||||||||||||||||||||
| #5182 | 23 Feb 2011 | Approved |
Notes:
Van Dorn required to obtain bottom sample without Matt Khoury's assistance. Probe touched bottom at 1m depth, hence 0.7m reading |
||||||||||||||||||||||||||
|
|||||||||||||||||||||||||||||
| #5329 | 23 Mar 2011 | Approved |
Notes:
Conductivity (12.81mS/cm) - checked at ambient/room temperature. Outward current was very strong. Bottom sampling was not possible. Jetty -bottom distance too great to use sampling bottle on pole. Hence no bottom turbidity or pH readings. |
||||||||||||||||||||||||||
|
|||||||||||||||||||||||||||||
| #5422 | 18 Apr 2011 | Approved |
Notes:
Bottle on pole unable to reach to sample from bottom.
|
||||||||||||||||||||||||||
|
|||||||||||||||||||||||||||||
| #5542 | 23 May 2011 | Approved |
Notes:
Although low tide was approx 50 mins prior to monitoring, there was still a strong outward current. Bottom sample not possible with bottle on pole |
||||||||||||||||||||||||||
|
|||||||||||||||||||||||||||||
| #5724 | 18 Jun 2011 | Approved |
|
||||||||||||||||||||||||||
|
|||||||||||||||||||||||||||||
| #5721 | 22 Jun 2011 | Approved |
Notes:
DO % difficult to read due to condensation in display of meter. Bottom sample not possible with equipment provided. |
||||||||||||||||||||||||||
|
|||||||||||||||||||||||||||||
| #6222 | 19 Oct 2011 | Approved |
Notes:
Salinity check within range. Calibration not required |
||||||||||||||||||||||||||
|
|||||||||||||||||||||||||||||
| #6381 | 2 Dec 2011 | Approved |
Notes:
Top sample for turbidity and pH collected at nearby boat ramp. Salinity was checked and and found to be within the acceptable range, so salinity calibration was not carried out. |
||||||||||||||||||||||||||
|
|||||||||||||||||||||||||||||
| #6712 | 8 Feb 2012 | Approved |
|
||||||||||||||||||||||||||
|
|||||||||||||||||||||||||||||

All content, files, data and images provided by the EstuaryWatch Data Portal and Gallery are subject to a Creative Commons Attribution License
Content is made available to be used in any way, and should always attribute EstuaryWatch and www.estuarywatch.org.au


