EstuaryWatch Data Portal
Ba1 Jetty near mouth
Active Physico-Chemical 09-10-2013 - 10-05-2023Balcombe Creek Estuary
| ID | Date | Status | Details | ||||||||||||||||||||||||||
|---|---|---|---|---|---|---|---|---|---|---|---|---|---|---|---|---|---|---|---|---|---|---|---|---|---|---|---|---|---|
| #12674 | 27 Jan 2019 | Approved |
Notes:
Turbidity measured with turbidity tube <10 at top and bottom |
||||||||||||||||||||||||||
|
|||||||||||||||||||||||||||||
| #12415 | 23 Sep 2018 | Approved |
|
||||||||||||||||||||||||||
|
|||||||||||||||||||||||||||||
| #12392 | 26 Aug 2018 | Approved |
Notes:
Drone image attached - Jetty Test Site 120 m August 2018 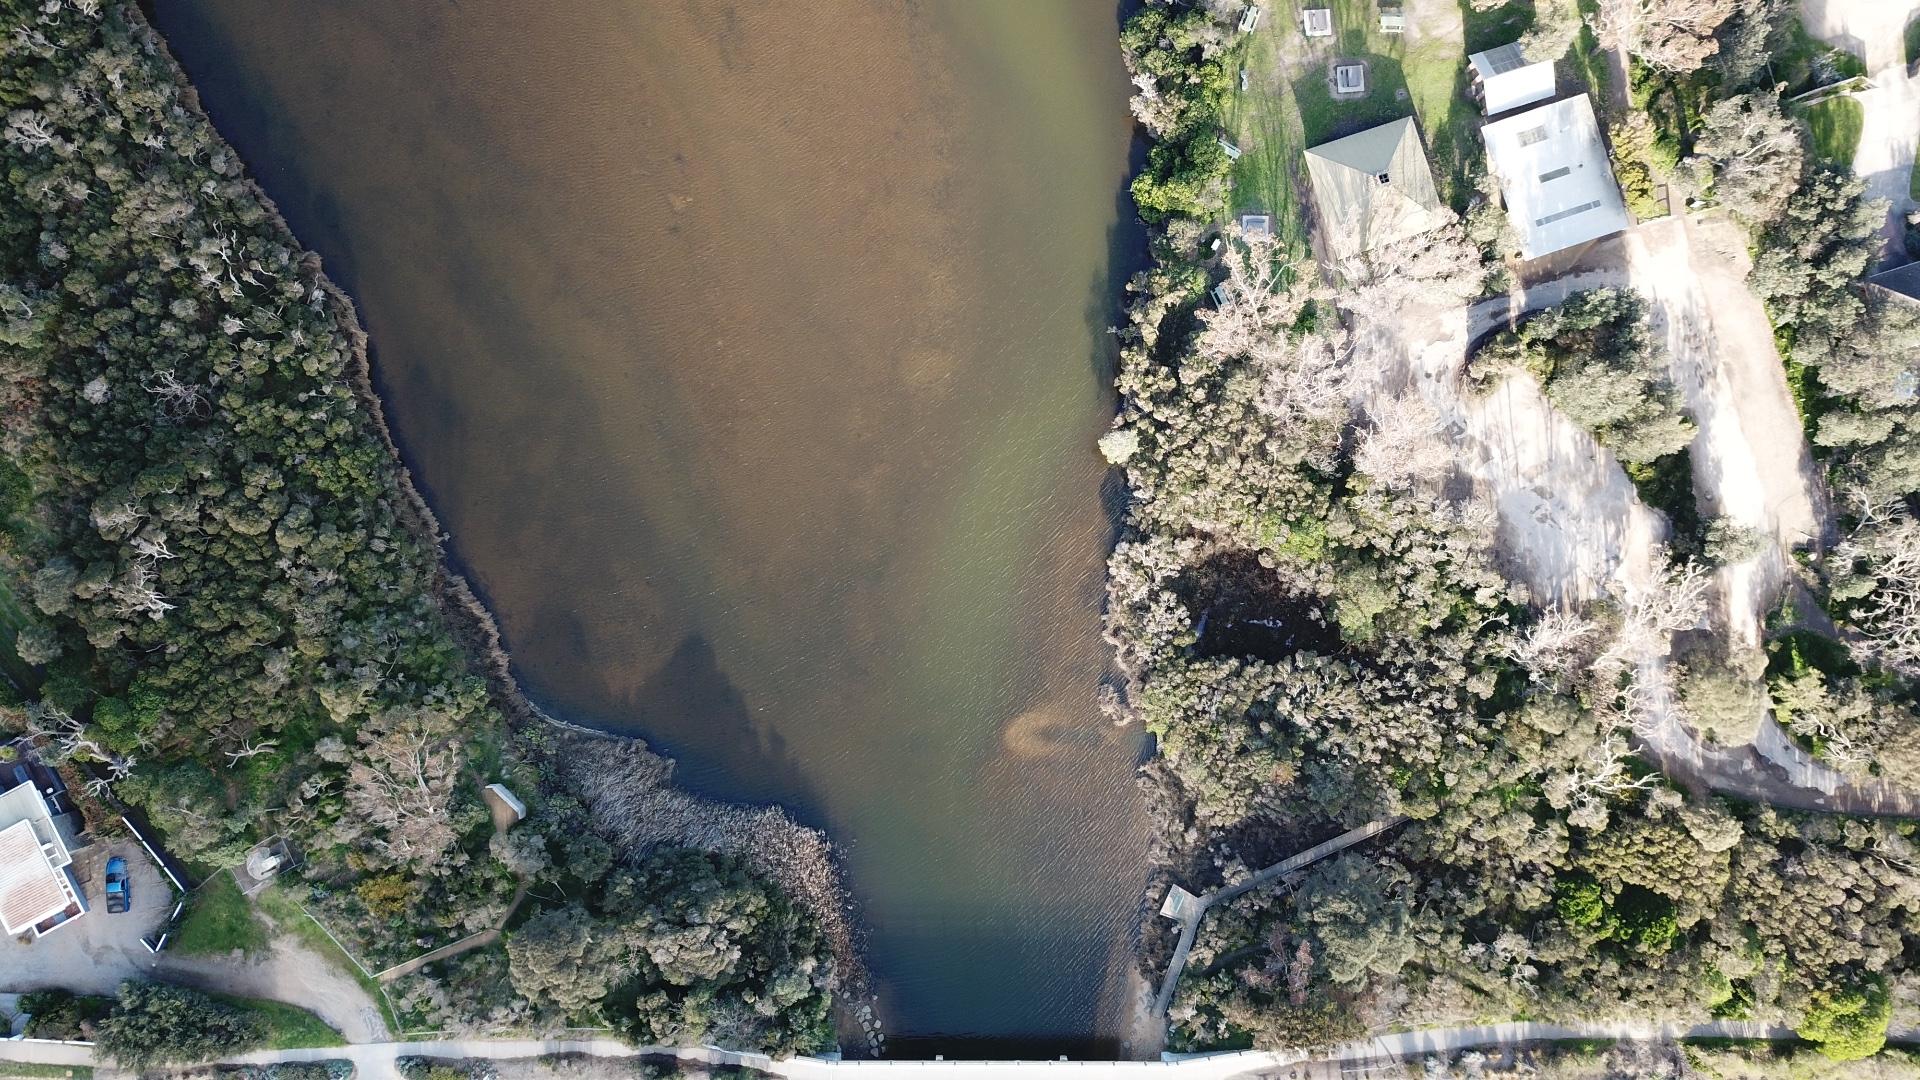 |
||||||||||||||||||||||||||
|
|||||||||||||||||||||||||||||
| #12388 | 22 Jul 2018 | Approved |
Notes:
Depth was not measured, water over jetty (see image). Greater than 1m. Jan and Andrew Jones. 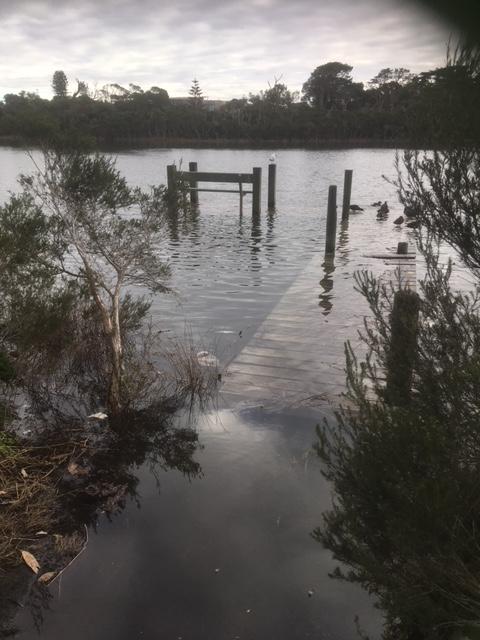 |
||||||||||||||||||||||||||
|
|||||||||||||||||||||||||||||
| #12222 | 27 Jun 2018 | Approved |
Notes:
I have had another look at the dissolved oxygen DO results for 27/6 as we were concerned about the very high readings. I went back to Augusta Street bridge the next day and took another reading which was considerably lower. Unfortunately I did not retest the other sites. I now believe that the meter was incorrectly calibrated so I think we should include a note to that effect on the data sheets. On re-reading the calibration data I did not allow enough time for the DO reading to stabilise. |
||||||||||||||||||||||||||
|
|||||||||||||||||||||||||||||
| #12164 | 27 May 2018 | Approved |
Notes:
No depth for 2 readings |
||||||||||||||||||||||||||
|
|||||||||||||||||||||||||||||
| #12010 | 22 Apr 2018 | Approved |
|
||||||||||||||||||||||||||
|
|||||||||||||||||||||||||||||
| #12171 | 24 Mar 2018 | Approved |
Notes:
Time approximate - not recorded on field data sheet |
||||||||||||||||||||||||||
|
|||||||||||||||||||||||||||||
| #12176 | 25 Feb 2018 | Approved |
Notes:
No stratification (sea water). Lack of stratification possibly due to the creek being very low (not flowing) for 2 months due to lack of rain. High tides and very strong westerlies (sometimes gale force) have probably pushed the seawater back up the estuary. The estuary flowing in reverse with resultant seawater. All samples of nearly pure sea water. Lower than usual pH samples. pH meter checked against standard afterwards. Met with Peter O'Brien on Monday 19th at Augusta bridge site tot discuss last months data. He as going to investigate storm water drains, including current citation oval damage to explain high B.O.D. and EColi count. |
||||||||||||||||||||||||||
|
|||||||||||||||||||||||||||||
| #11954 | 28 Jan 2018 | Approved |
|
||||||||||||||||||||||||||
|
|||||||||||||||||||||||||||||

All content, files, data and images provided by the EstuaryWatch Data Portal and Gallery are subject to a Creative Commons Attribution License
Content is made available to be used in any way, and should always attribute EstuaryWatch and www.estuarywatch.org.au