| #12171
|
24 Mar 2018
|
Approved |
Notes:
Time approximate - not recorded on field data sheet
|
|
Depth
|
Turb NTU
|
pH
|
Temp ° C
|
Salin ppt
|
D.O. mg/L
|
D.O. % sat
|
EC mS/cm
|
|
0.1m
|
10.0 |
8.3 |
19.30 |
37.80 |
3.52 |
57.2 |
56.80 |
|
0.5m
|
10.0 |
8.1 |
19.20 |
38.10 |
2.67 |
36.1 |
57.10 |
|
| #12010
|
22 Apr 2018
|
Approved |
|
|
Depth
|
Turb NTU
|
pH
|
Temp ° C
|
Salin ppt
|
D.O. mg/L
|
D.O. % sat
|
EC mS/cm
|
|
0.1m
|
10.0 |
7.7 |
15.00 |
18.70 |
9.66 |
108.8 |
30.00 |
|
1.0m
|
10.0 |
7.0 |
19.10 |
26.50 |
4.77 |
56.3 |
41.05 |
|
| #12164
|
27 May 2018
|
Approved |
Notes:
No depth for 2 readings
|
|
Depth
|
Turb NTU
|
pH
|
Temp ° C
|
Salin ppt
|
D.O. mg/L
|
D.O. % sat
|
EC mS/cm
|
|
0.1m
|
40.0 |
6.2 |
15.00 |
18.70 |
9.66 |
108.8 |
30.00 |
|
1.0m
|
40.0 |
6.2 |
19.10 |
26.50 |
4.77 |
56.3 |
41.05 |
|
| #12222
|
27 Jun 2018
|
Approved |
Notes:
I have had another look at the dissolved oxygen DO results for 27/6 as we were concerned about the very high readings. I went back to Augusta Street bridge the next day and took another reading which was considerably lower. Unfortunately I did not retest the other sites. I now believe that the meter was incorrectly calibrated so I think we should include a note to that effect on the data sheets. On re-reading the calibration data I did not allow enough time for the DO reading to stabilise.
I will allow more time for future calibrations. Jan Jones
|
|
Depth
|
Turb NTU
|
pH
|
Temp ° C
|
Salin ppt
|
D.O. mg/L
|
D.O. % sat
|
EC mS/cm
|
|
0.1m
|
10.0 |
6.6 |
15.00 |
18.70 |
9.66 |
108.8 |
30.00 |
|
1.0m
|
10.0 |
6.6 |
19.10 |
26.50 |
4.77 |
56.3 |
41.05 |
|
| #12388
|
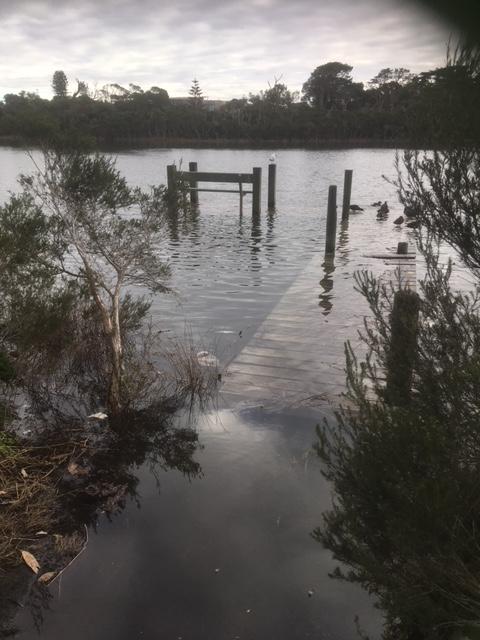
22 Jul 2018
|
Approved |
Notes:
Depth was not measured, water over jetty (see image). Greater than 1m. Jan and Andrew Jones.
|
|
Depth
|
Turb NTU
|
pH
|
Temp ° C
|
Salin ppt
|
D.O. mg/L
|
D.O. % sat
|
EC mS/cm
|
|
0.1m
|
10.0 |
7.7 |
15.00 |
18.70 |
9.66 |
108.8 |
30.00 |
|
1.0m
|
10.0 |
|
19.10 |
26.50 |
4.77 |
56.3 |
41.05 |
|
| #12392
|
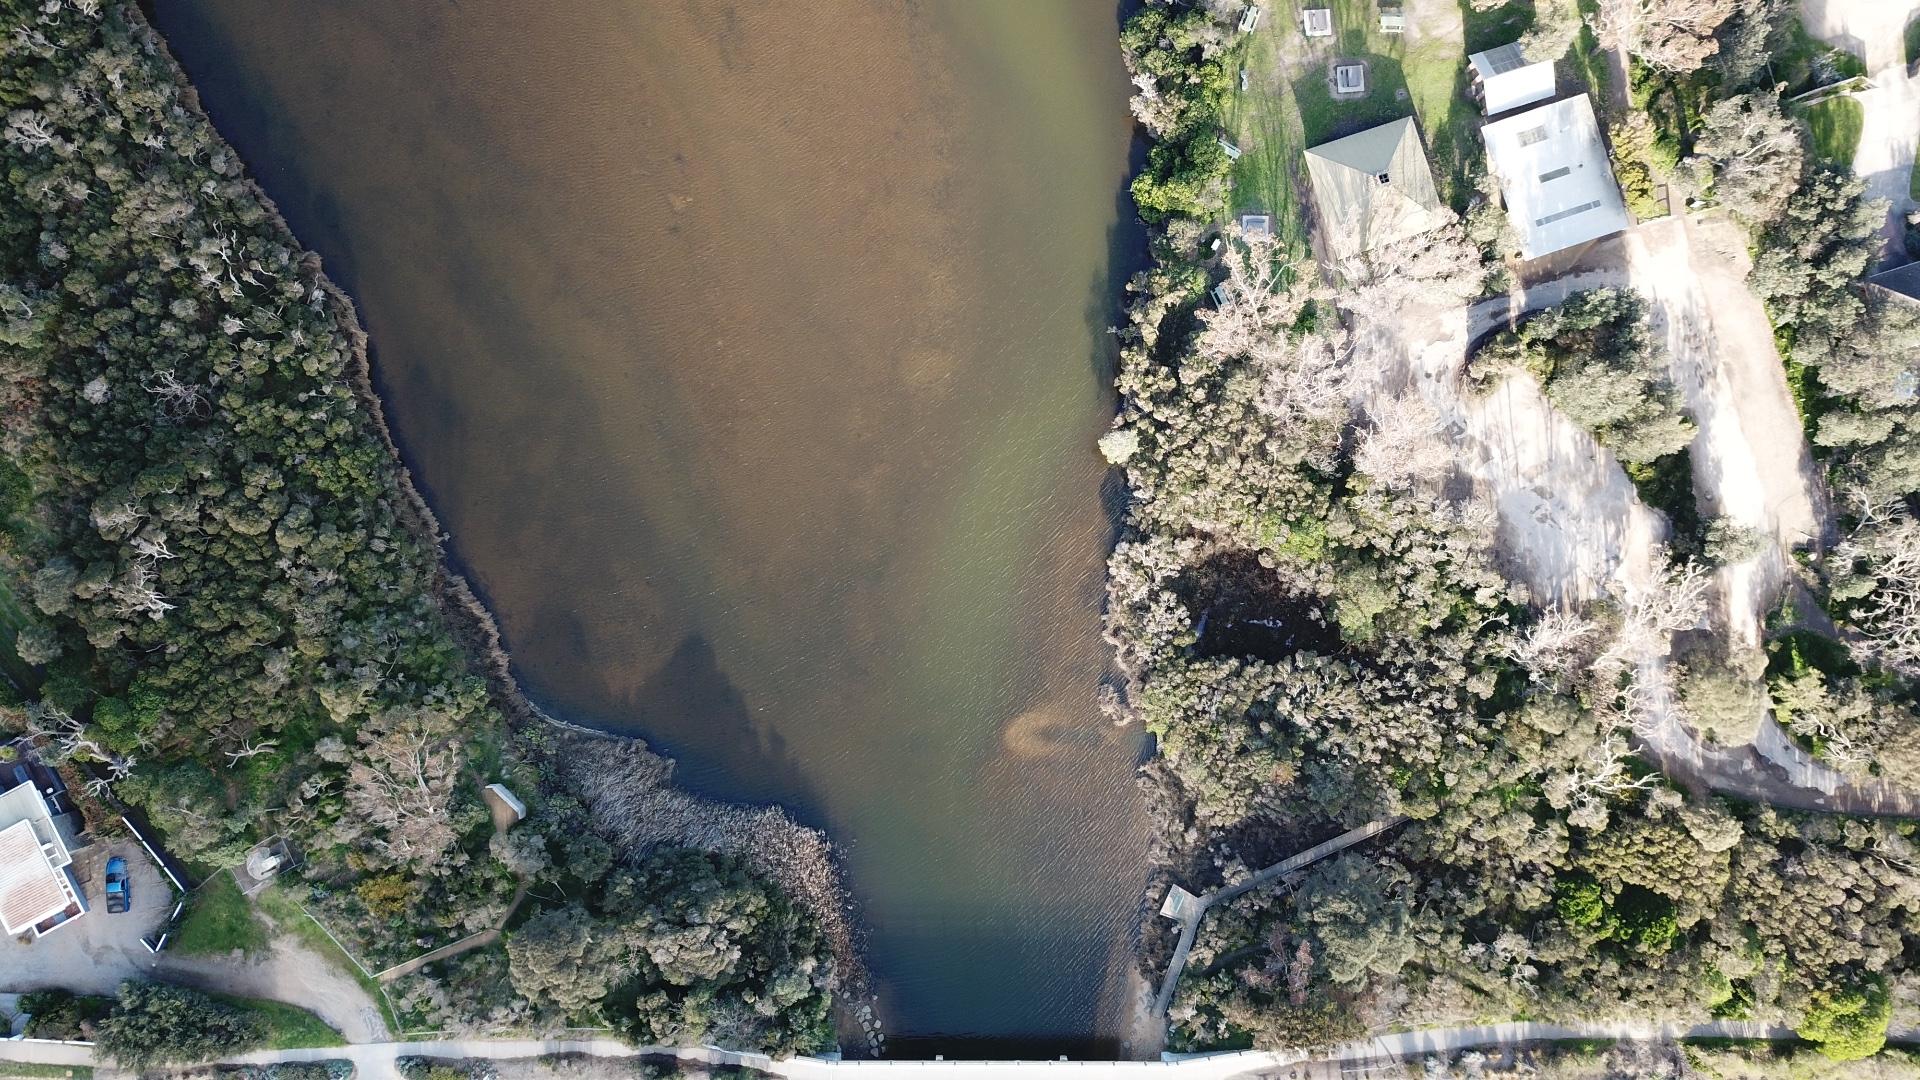
26 Aug 2018
|
Approved |
Notes:
Drone image attached - Jetty Test Site 120 m August 2018
|
|
Depth
|
Turb NTU
|
pH
|
Temp ° C
|
Salin ppt
|
D.O. mg/L
|
D.O. % sat
|
EC mS/cm
|
|
0.1m
|
10.0 |
6.0 |
9.60 |
3.50 |
0.00 |
0.0 |
6.46 |
|
0.2m
|
10.0 |
6.0 |
11.10 |
30.20 |
0.00 |
0.0 |
46.42 |
|
| #12415
|
23 Sep 2018
|
Approved |
|
|
Depth
|
Turb NTU
|
pH
|
Temp ° C
|
Salin ppt
|
D.O. mg/L
|
D.O. % sat
|
EC mS/cm
|
|
0.1m
|
15.0 |
7.9 |
9.60 |
3.50 |
0.00 |
0.0 |
6.46 |
|
0.2m
|
15.0 |
7.9 |
11.10 |
30.20 |
0.00 |
0.0 |
46.42 |
|
| #12674
|
27 Jan 2019
|
Approved |
Notes:
Turbidity measured with turbidity tube <10 at top and bottom
|
|
Depth
|
Turb NTU
|
pH
|
Temp ° C
|
Salin ppt
|
D.O. mg/L
|
D.O. % sat
|
EC mS/cm
|
|
0.1m
|
10.0 |
6.3 |
21.30 |
26.80 |
4.45 |
58.1 |
41.69 |
|
0.4m
|
10.0 |
6.1 |
21.60 |
33.80 |
4.94 |
68.7 |
51.40 |
|
| #13275
|
24 Feb 2019
|
Approved |
|
|
Depth
|
Turb NTU
|
pH
|
Temp ° C
|
Salin ppt
|
D.O. mg/L
|
D.O. % sat
|
EC mS/cm
|
|
0.1m
|
10.0 |
6.1 |
19.50 |
35.10 |
0.00 |
0.0 |
53.00 |
|
0.5m
|
10.0 |
6.2 |
19.50 |
35.10 |
0.00 |
0.0 |
53.10 |
|
| #12789
|
24 Mar 2019
|
Approved |
|
|
Depth
|
Turb NTU
|
pH
|
Temp ° C
|
Salin ppt
|
D.O. mg/L
|
D.O. % sat
|
EC mS/cm
|
|
0.1m
|
10.0 |
6.2 |
20.40 |
37.10 |
11.70 |
0.0 |
55.70 |
|
0.5m
|
10.0 |
5.8 |
20.40 |
37.00 |
11.50 |
0.0 |
55.60 |
|