| #5166
|
25 Jun 2013
|
Approved |
Notes:
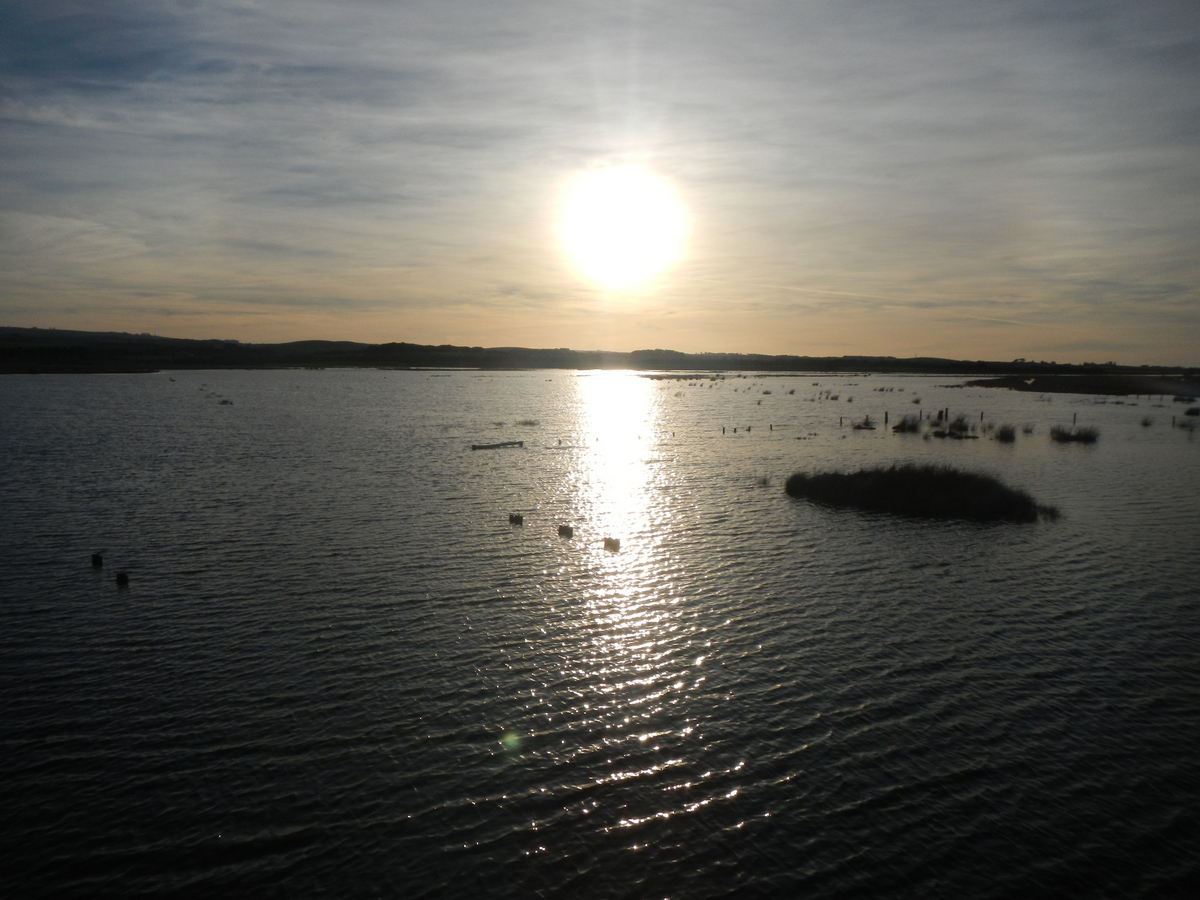
Wind picking up from the east. Very sunny and clear day.
|
|
Depth
|
Turb NTU
|
pH
|
Temp ° C
|
Salin ppt
|
D.O. mg/L
|
D.O. % sat
|
EC mS/cm
|
|
0.1m
|
20.0 |
7.3 |
8.00 |
0.70 |
8.39 |
71.2 |
1.37 |
|
3.9m
|
20.0 |
7.8 |
10.30 |
16.60 |
7.03 |
69.6 |
27.22 |
|
| #5164
|
20 Jun 2013
|
Approved |
|
|
Depth
|
Turb NTU
|
pH
|
Temp ° C
|
Salin ppt
|
D.O. mg/L
|
D.O. % sat
|
EC mS/cm
|
|
0.1m
|
|
|
8.90 |
0.40 |
7.40 |
64.2 |
0.80 |
|
4.3m
|
|
|
9.00 |
0.40 |
6.94 |
60.3 |
0.85 |
|
| #5161
|
17 Jun 2013
|
Approved |
Notes:
Water very turbid still.
|
|
Depth
|
Turb NTU
|
pH
|
Temp ° C
|
Salin ppt
|
D.O. mg/L
|
D.O. % sat
|
EC mS/cm
|
|
0.1m
|
|
|
10.60 |
0.60 |
7.05 |
64.0 |
1.21 |
|
4.5m
|
|
|
10.60 |
0.70 |
6.83 |
61.2 |
1.42 |
|
| #5160
|
15 Jun 2013
|
Approved |
Notes:
Flow still steady, water very turbid. Quite an aroma present down at the estuary.
|
|
Depth
|
Turb NTU
|
pH
|
Temp ° C
|
Salin ppt
|
D.O. mg/L
|
D.O. % sat
|
EC mS/cm
|
|
0.1m
|
|
|
11.00 |
1.10 |
6.42 |
63.5 |
2.06 |
|
4.5m
|
|
|
10.80 |
1.20 |
6.52 |
59.8 |
2.36 |
|
| #5159
|
14 Jun 2013
|
Approved |
Notes:
Flow still quite strong. Water very turbid.
|
|
Depth
|
Turb NTU
|
pH
|
Temp ° C
|
Salin ppt
|
D.O. mg/L
|
D.O. % sat
|
EC mS/cm
|
|
0.1m
|
|
|
12.10 |
4.30 |
8.40 |
80.2 |
7.62 |
|
5.0m
|
|
|
12.20 |
5.00 |
8.29 |
79.8 |
8.68 |
|
| #5155
|
14 Jun 2013
|
Approved |
Notes:
Mouth opened naturally at roughly 8:30 to 9am
|
|
Depth
|
Turb NTU
|
pH
|
Temp ° C
|
Salin ppt
|
D.O. mg/L
|
D.O. % sat
|
EC mS/cm
|
|
0.1m
|
|
|
11.80 |
3.50 |
7.99 |
75.4 |
6.51 |
|
5.0m
|
|
|
13.40 |
30.40 |
0.03 |
0.4 |
46.62 |
|
| #5156
|
14 Jun 2013
|
Approved |
Notes:
Mouth opened naturally between 8:30 - 9:00am
|
|
Depth
|
Turb NTU
|
pH
|
Temp ° C
|
Salin ppt
|
D.O. mg/L
|
D.O. % sat
|
EC mS/cm
|
|
0.1m
|
|
|
11.40 |
3.90 |
7.57 |
73.2 |
7.03 |
|
5.0m
|
|
|
13.50 |
31.80 |
0.02 |
0.2 |
48.70 |
|
| #5154
|
13 Jun 2013
|
Approved |
|
|
Depth
|
Turb NTU
|
pH
|
Temp ° C
|
Salin ppt
|
D.O. mg/L
|
D.O. % sat
|
EC mS/cm
|
|
0.1m
|
|
|
11.70 |
5.40 |
9.52 |
89.2 |
9.65 |
|
5.0m
|
|
|
13.40 |
31.60 |
0.03 |
0.4 |
48.51 |
|
| #5149
|
9 Jun 2013
|
Approved |
Notes:
River very high.
Gauge board well below the surface of the water.
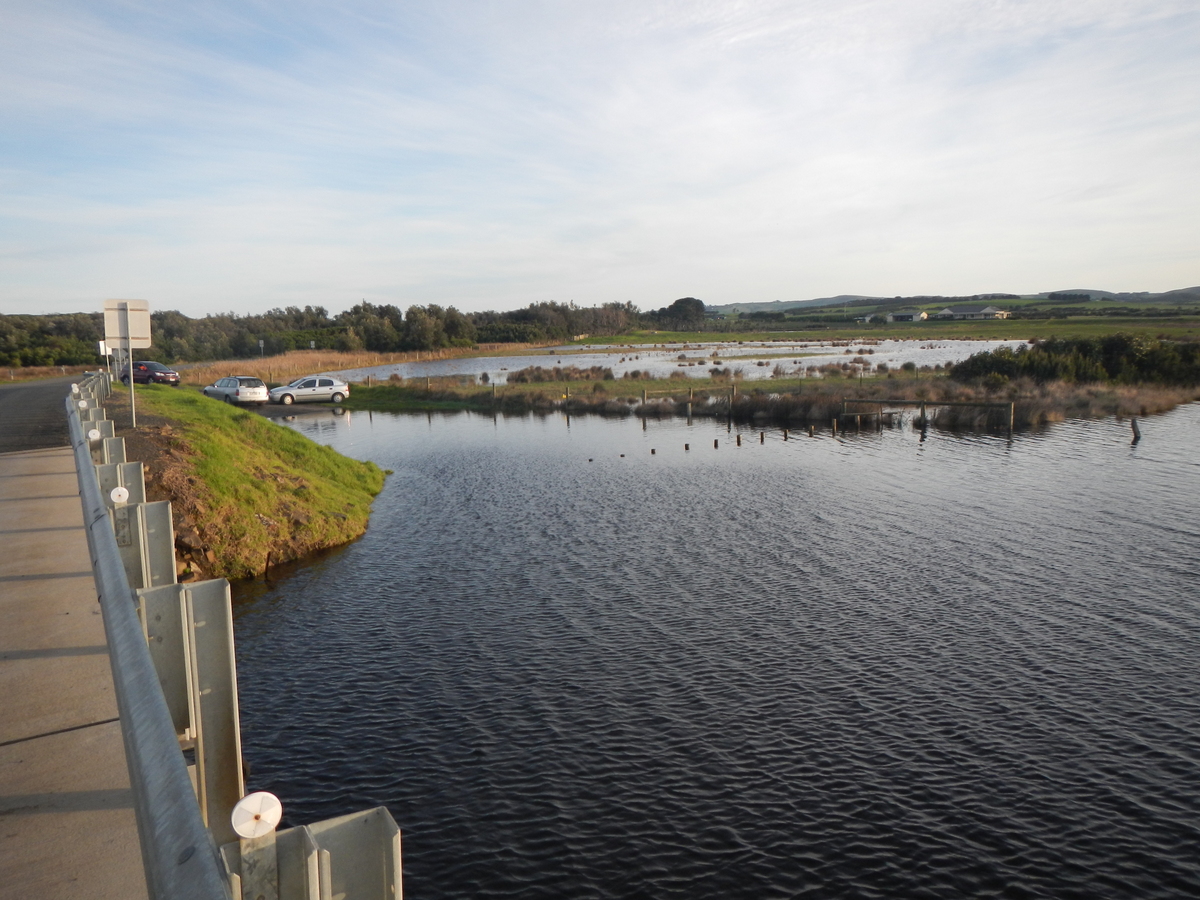
Large body of water covering crown land up stream from the car bridge.
|
|
Depth
|
Turb NTU
|
pH
|
Temp ° C
|
Salin ppt
|
D.O. mg/L
|
D.O. % sat
|
EC mS/cm
|
|
0.1m
|
8.0 |
7.8 |
9.20 |
12.20 |
10.52 |
100.0 |
20.40 |
|
5.0m
|
8.0 |
7.2 |
13.20 |
31.50 |
0.04 |
0.4 |
48.37 |
|
| #5150
|
8 Jun 2013
|
Approved |
|
|
Depth
|
Turb NTU
|
pH
|
Temp ° C
|
Salin ppt
|
D.O. mg/L
|
D.O. % sat
|
EC mS/cm
|
|
0.1m
|
|
|
9.70 |
12.50 |
7.80 |
74.0 |
20.84 |
|
5.0m
|
|
|
13.20 |
31.60 |
0.02 |
0.3 |
48.39 |
|
| #5147
|
2 Jun 2013
|
Approved |
Notes:
Very loud frog calling on Western side of Powlett channel.
Two varieties of Ibis present on property on Western side of the main channel, upstream of the Powlett River Bridge.
|
|
Depth
|
Turb NTU
|
pH
|
Temp ° C
|
Salin ppt
|
D.O. mg/L
|
D.O. % sat
|
EC mS/cm
|
|
0.1m
|
12.0 |
8.2 |
13.70 |
13.90 |
10.30 |
107.7 |
22.94 |
|
5.0m
|
12.0 |
7.6 |
13.20 |
31.70 |
0.16 |
2.1 |
48.60 |
|
| #5145
|
27 May 2013
|
Approved |
Notes:
Frogs and birds inhabitating wetlands can be clearly heard from this site.
Black lines clearly visible from the top of the turbidity tube.
|
|
Depth
|
Turb NTU
|
pH
|
Temp ° C
|
Salin ppt
|
D.O. mg/L
|
D.O. % sat
|
EC mS/cm
|
|
0.1m
|
10.0 |
7.8 |
13.10 |
10.80 |
9.07 |
92.0 |
17.58 |
|
5.0m
|
10.0 |
7.4 |
13.00 |
31.80 |
1.13 |
12.6 |
48.74 |
|
| #5144
|
21 May 2013
|
Approved |
|
|
Depth
|
Turb NTU
|
pH
|
Temp ° C
|
Salin ppt
|
D.O. mg/L
|
D.O. % sat
|
EC mS/cm
|
|
0.1m
|
10.0 |
8.0 |
11.70 |
22.70 |
7.80 |
85.0 |
35.70 |
|
5.0m
|
10.0 |
7.8 |
12.90 |
31.90 |
3.06 |
34.4 |
48.80 |
|
| #5138
|
18 May 2013
|
Approved |
Notes:
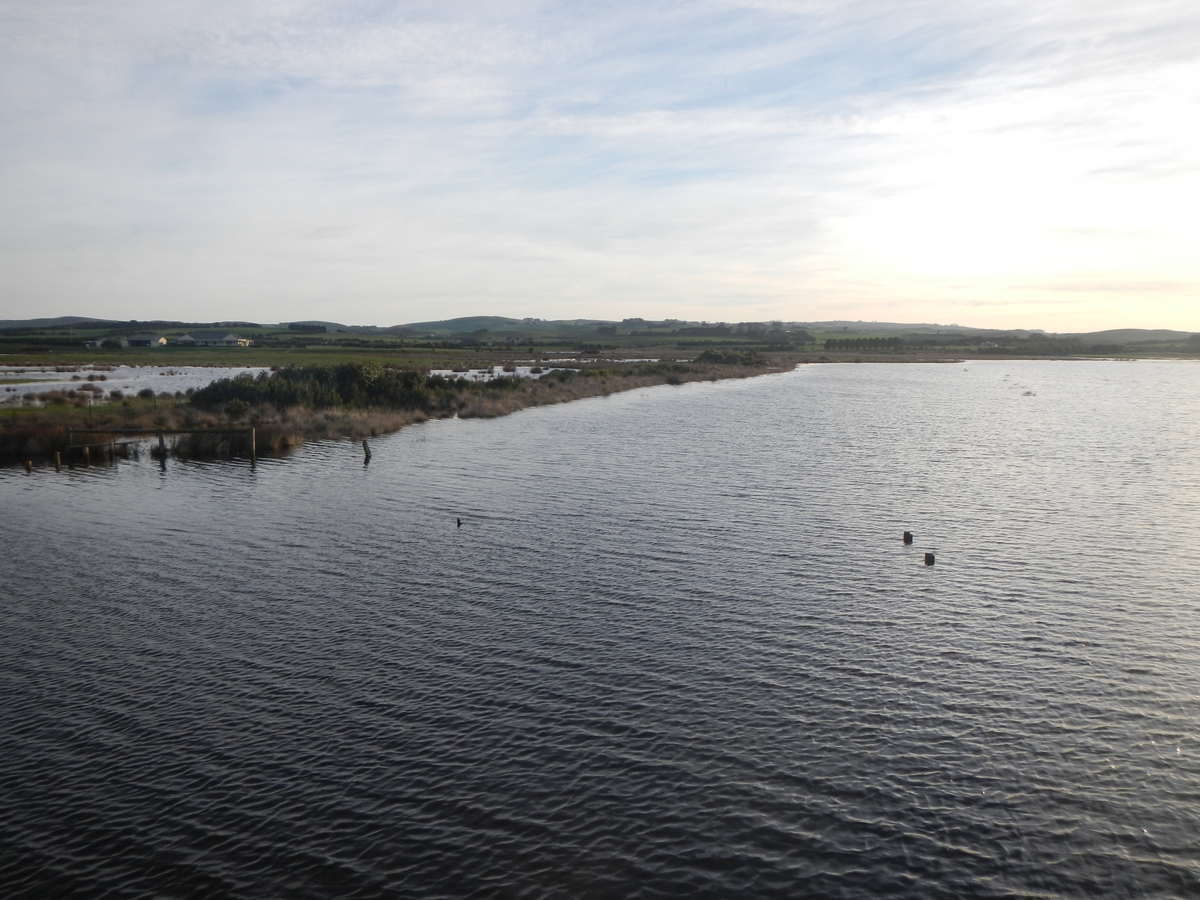
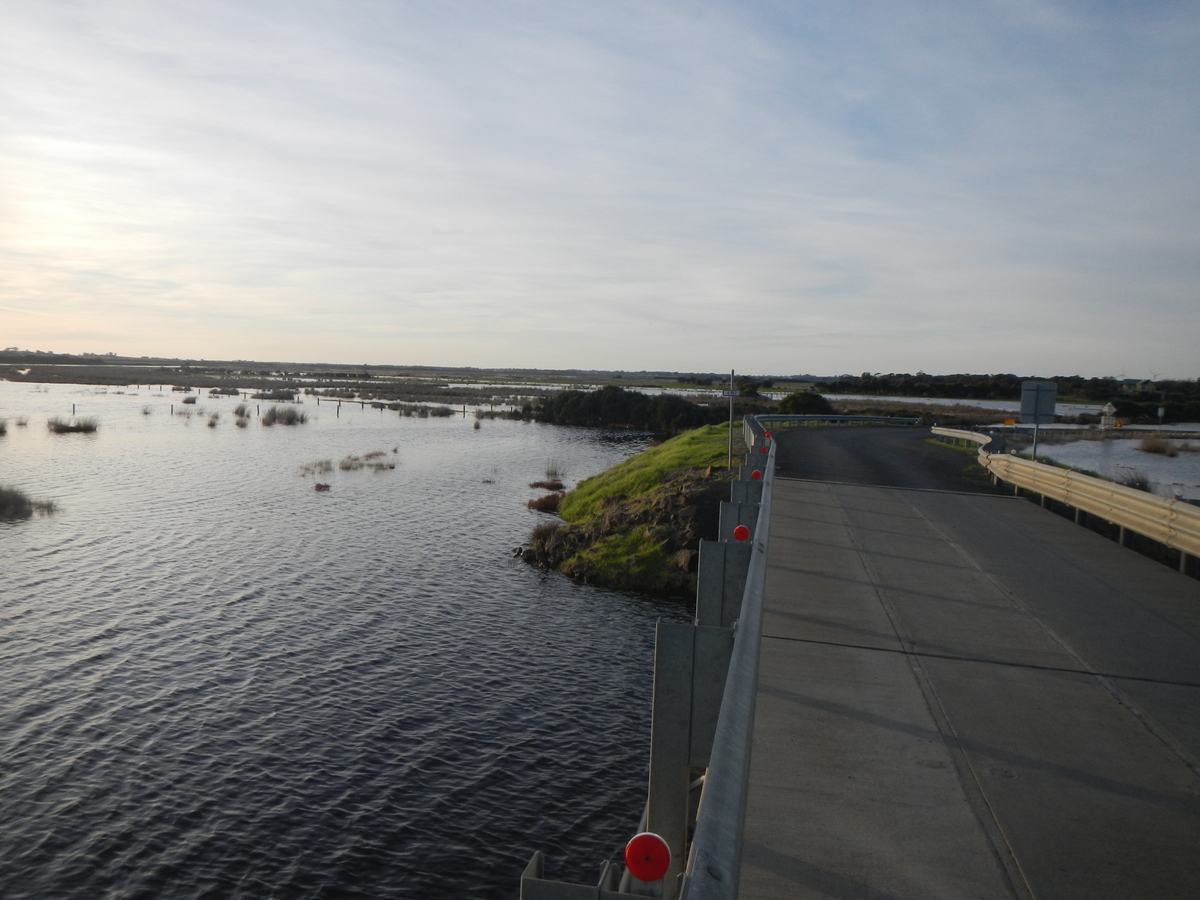
The river banks up stream from the bridge are covered in flood waters. Most of the conservation area is covered in water. The lower part of the carpark beside the bridge is being flooded.
|
|
Depth
|
Turb NTU
|
pH
|
Temp ° C
|
Salin ppt
|
D.O. mg/L
|
D.O. % sat
|
EC mS/cm
|
|
0.1m
|
9.0 |
7.7 |
11.80 |
30.60 |
7.65 |
87.0 |
47.20 |
|
4.5m
|
9.0 |
7.6 |
12.70 |
31.70 |
5.50 |
63.3 |
48.59 |
|
| #5141
|
17 May 2013
|
Approved |
Notes:
Gaugeboard reading: 1.895.
Flood plains covered
|
|
Depth
|
Turb NTU
|
pH
|
Temp ° C
|
Salin ppt
|
D.O. mg/L
|
D.O. % sat
|
EC mS/cm
|
|
0.1m
|
|
|
12.20 |
30.70 |
6.92 |
78.8 |
47.29 |
|
4.9m
|
|
|
12.50 |
31.80 |
5.00 |
54.0 |
48.77 |
|
| #5135
|
14 May 2013
|
Approved |
Notes:
New WGCMA YSI meter used. Uncertain of the YSI number.
Wet, windy, overcast day.
|
|
Depth
|
Turb NTU
|
pH
|
Temp ° C
|
Salin ppt
|
D.O. mg/L
|
D.O. % sat
|
EC mS/cm
|
|
0.1m
|
10.0 |
6.6 |
13.20 |
32.10 |
6.06 |
71.5 |
49.21 |
|
4.7m
|
10.0 |
6.9 |
14.00 |
33.20 |
2.33 |
27.3 |
50.60 |
|
| #5134
|
5 May 2013
|
Approved |
Notes:
Water birds are beginning to take advantage of the flooded river banks to the north of the bridge. The water is beginning to rise into the car park next to the car bridge.
|
|
Depth
|
Turb NTU
|
pH
|
Temp ° C
|
Salin ppt
|
D.O. mg/L
|
D.O. % sat
|
EC mS/cm
|
|
0.1m
|
9.0 |
8.0 |
12.80 |
32.90 |
7.50 |
89.1 |
50.40 |
|
4.5m
|
9.0 |
8.2 |
13.40 |
33.40 |
7.29 |
85.6 |
51.00 |
|
| #5132
|
1 May 2013
|
Approved |
Notes:
Matt required to surf the river to retrieve the pH monitor.
pH monitor returned unscathed.
|
|
Depth
|
Turb NTU
|
pH
|
Temp ° C
|
Salin ppt
|
D.O. mg/L
|
D.O. % sat
|
EC mS/cm
|
|
0.1m
|
9.0 |
8.1 |
14.00 |
32.30 |
6.40 |
76.0 |
49.41 |
|
4.7m
|
9.0 |
8.1 |
16.10 |
34.50 |
4.50 |
53.7 |
52.30 |
|
| #5129
|
20 Apr 2013
|
Approved |
|
|
Depth
|
Turb NTU
|
pH
|
Temp ° C
|
Salin ppt
|
D.O. mg/L
|
D.O. % sat
|
EC mS/cm
|
|
0.1m
|
1.0 |
8.0 |
13.50 |
30.60 |
6.75 |
79.8 |
47.02 |
|
4.4m
|
1.0 |
8.0 |
15.70 |
33.50 |
4.20 |
52.0 |
51.00 |
|
| #5127
|
24 Mar 2013
|
Approved |
Notes:
Robbie angry at black cord on YSI monitor.
Unable to locate turbidity tube leg rope.
|
|
Depth
|
Turb NTU
|
pH
|
Temp ° C
|
Salin ppt
|
D.O. mg/L
|
D.O. % sat
|
EC mS/cm
|
|
0.1m
|
10.0 |
7.9 |
17.80 |
34.80 |
6.10 |
80.5 |
52.70 |
|
4.0m
|
10.0 |
8.2 |
17.80 |
34.90 |
6.01 |
76.9 |
52.80 |
|
| #5102
|
9 Feb 2013
|
Approved |
Notes:
The river remained at the same height from the start to the finish of the monitoring. The sand build up at the mouth may be preventing the river from emptying out. There was a small amount of flow from the mouth into the sea.
|
|
Depth
|
Turb NTU
|
pH
|
Temp ° C
|
Salin ppt
|
D.O. mg/L
|
D.O. % sat
|
EC mS/cm
|
|
0.1m
|
10.0 |
8.1 |
22.70 |
34.80 |
5.75 |
82.0 |
52.80 |
|
4.0m
|
10.0 |
8.2 |
20.40 |
35.10 |
5.28 |
70.0 |
53.10 |
|
| #5091
|
16 Dec 2012
|
Approved |
Notes:
Accidentally kicked turbidity tube into the Powlett. It has gone to join the old lead weight from the Van Dorn. Robbie was working very hard to get the job done quickly due to an overwhelming urge to clean his house.
Young lady fishing below the bridge pulled in healthy quantity of seaweed.
The results indicate that there is very little fresh water on the surface of the river..
|
|
Depth
|
Turb NTU
|
pH
|
Temp ° C
|
Salin ppt
|
D.O. mg/L
|
D.O. % sat
|
EC mS/cm
|
|
0.1m
|
10.0 |
8.0 |
18.40 |
33.80 |
6.10 |
76.5 |
51.30 |
|
4.0m
|
10.0 |
8.3 |
17.60 |
34.90 |
5.96 |
75.0 |
52.80 |
|
| #5089
|
3 Nov 2012
|
Approved |
Notes:
QAQC conducted today. Mike, Mark, Harry and Adam were unable to attend. Written test conducted at the KGC.
|
|
Depth
|
Turb NTU
|
pH
|
Temp ° C
|
Salin ppt
|
D.O. mg/L
|
D.O. % sat
|
EC mS/cm
|
|
0.1m
|
15.0 |
7.2 |
15.00 |
7.20 |
7.00 |
72.5 |
12.50 |
|
3.5m
|
15.0 |
7.5 |
14.90 |
34.70 |
7.33 |
89.3 |
52.60 |
|
| #5082
|
6 Oct 2012
|
Approved |
|
|
Depth
|
Turb NTU
|
pH
|
Temp ° C
|
Salin ppt
|
D.O. mg/L
|
D.O. % sat
|
EC mS/cm
|
|
0.1m
|
40.0 |
7.1 |
15.10 |
2.90 |
6.36 |
64.7 |
5.30 |
|
3.0m
|
40.0 |
7.3 |
13.90 |
33.50 |
8.40 |
99.8 |
51.00 |
|
| #5042
|
8 Sep 2012
|
Approved |
Notes:
Very strong out going current dragged the van dorf even with the weight so it was difficult to know if we reached the bottom.
|
|
Depth
|
Turb NTU
|
pH
|
Temp ° C
|
Salin ppt
|
D.O. mg/L
|
D.O. % sat
|
EC mS/cm
|
|
0.1m
|
50.0 |
6.8 |
10.60 |
2.40 |
10.13 |
93.0 |
4.42 |
|
4.5m
|
50.0 |
7.5 |
11.90 |
33.80 |
8.58 |
98.1 |
51.60 |
|