| #14468
|
2 Feb 2022
|
Approved |
|
|
Depth
|
Turb NTU
|
pH
|
Temp ° C
|
Salin ppt
|
D.O. mg/L
|
D.O. % sat
|
EC mS/cm
|
|
0.1m
|
9.0 |
8.8 |
19.30 |
|
6.89 |
74.5 |
40.70 |
|
1.9m
|
9.0 |
8.8 |
19.60 |
|
7.76 |
85.6 |
43.00 |
|
| #14433
|
4 Jan 2022
|
Approved |
|
|
Depth
|
Turb NTU
|
pH
|
Temp ° C
|
Salin ppt
|
D.O. mg/L
|
D.O. % sat
|
EC mS/cm
|
|
0.1m
|
9.0 |
8.8 |
20.00 |
|
9.28 |
102.0 |
53.50 |
|
1.6m
|
9.0 |
8.5 |
20.10 |
|
9.72 |
107.5 |
53.90 |
|
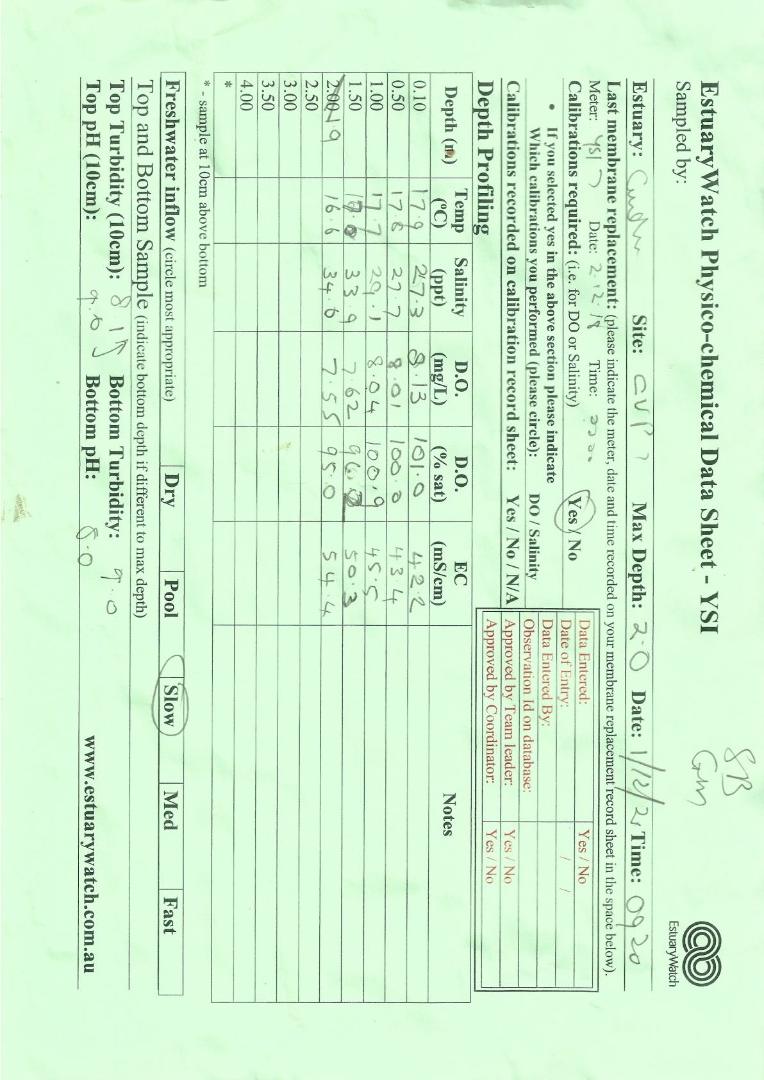
| #14389
|
7 Dec 2021
|
Approved |
|
|
Depth
|
Turb NTU
|
pH
|
Temp ° C
|
Salin ppt
|
D.O. mg/L
|
D.O. % sat
|
EC mS/cm
|
|
0.1m
|
9.0 |
8.0 |
16.50 |
|
9.31 |
95.5 |
55.50 |
|
2.0m
|
9.0 |
8.1 |
16.40 |
|
9.39 |
96.3 |
56.10 |
|
| #14334
|
2 Nov 2021
|
Approved |
|
|
Depth
|
Turb NTU
|
pH
|
Temp ° C
|
Salin ppt
|
D.O. mg/L
|
D.O. % sat
|
EC mS/cm
|
|
0.1m
|
40.0 |
8.3 |
16.80 |
|
8.06 |
|
2.64 |
|
1.8m
|
40.0 |
8.3 |
16.00 |
|
7.81 |
|
2.74 |
|
| #14305
|
8 Oct 2021
|
Approved |
|
|
Depth
|
Turb NTU
|
pH
|
Temp ° C
|
Salin ppt
|
D.O. mg/L
|
D.O. % sat
|
EC mS/cm
|
|
0.1m
|
23.0 |
8.4 |
12.10 |
|
12.46 |
115.1 |
12.94 |
|
1.8m
|
23.0 |
8.3 |
13.10 |
|
9.73 |
95.2 |
52.50 |
|
| #14226
|
3 Aug 2021
|
Approved |
Notes:
No photos were taken during this monitoring session. Photos are to be taken later in the week
|
|
Depth
|
Turb NTU
|
pH
|
Temp ° C
|
Salin ppt
|
D.O. mg/L
|
D.O. % sat
|
EC mS/cm
|
|
0.1m
|
30.0 |
7.5 |
11.20 |
|
11.22 |
102.9 |
16.70 |
|
2.3m
|
30.0 |
7.8 |
12.30 |
|
11.13 |
107.4 |
56.30 |
|
| #14191
|
6 Jul 2021
|
Approved |
|
|
Depth
|
Turb NTU
|
pH
|
Temp ° C
|
Salin ppt
|
D.O. mg/L
|
D.O. % sat
|
EC mS/cm
|
|
0.1m
|
40.0 |
7.5 |
9.40 |
|
9.06 |
77.2 |
16.39 |
|
1.9m
|
40.0 |
7.3 |
9.10 |
|
8.96 |
77.2 |
11.95 |
|
| #14155
|
11 Jun 2021
|
Approved |
Notes:
River re-opened, and running fast, brown in colour.
No signs of blue-green algae.pH meter did not show a smiley face after a 5 minute wait, the test was repeated with a new sample and was completed satisafactorily
Bird life abundant
No wind, brilliant sunshine
|
|
Depth
|
Turb NTU
|
pH
|
Temp ° C
|
Salin ppt
|
D.O. mg/L
|
D.O. % sat
|
EC mS/cm
|
|
0.1m
|
100.0 |
7.4 |
11.00 |
|
6.65 |
60.1 |
2.16 |
|
2.3m
|
100.0 |
8.2 |
10.70 |
|
6.53 |
59.0 |
2.20 |
|
| #14104
|
4 May 2021
|
Approved |
Notes:
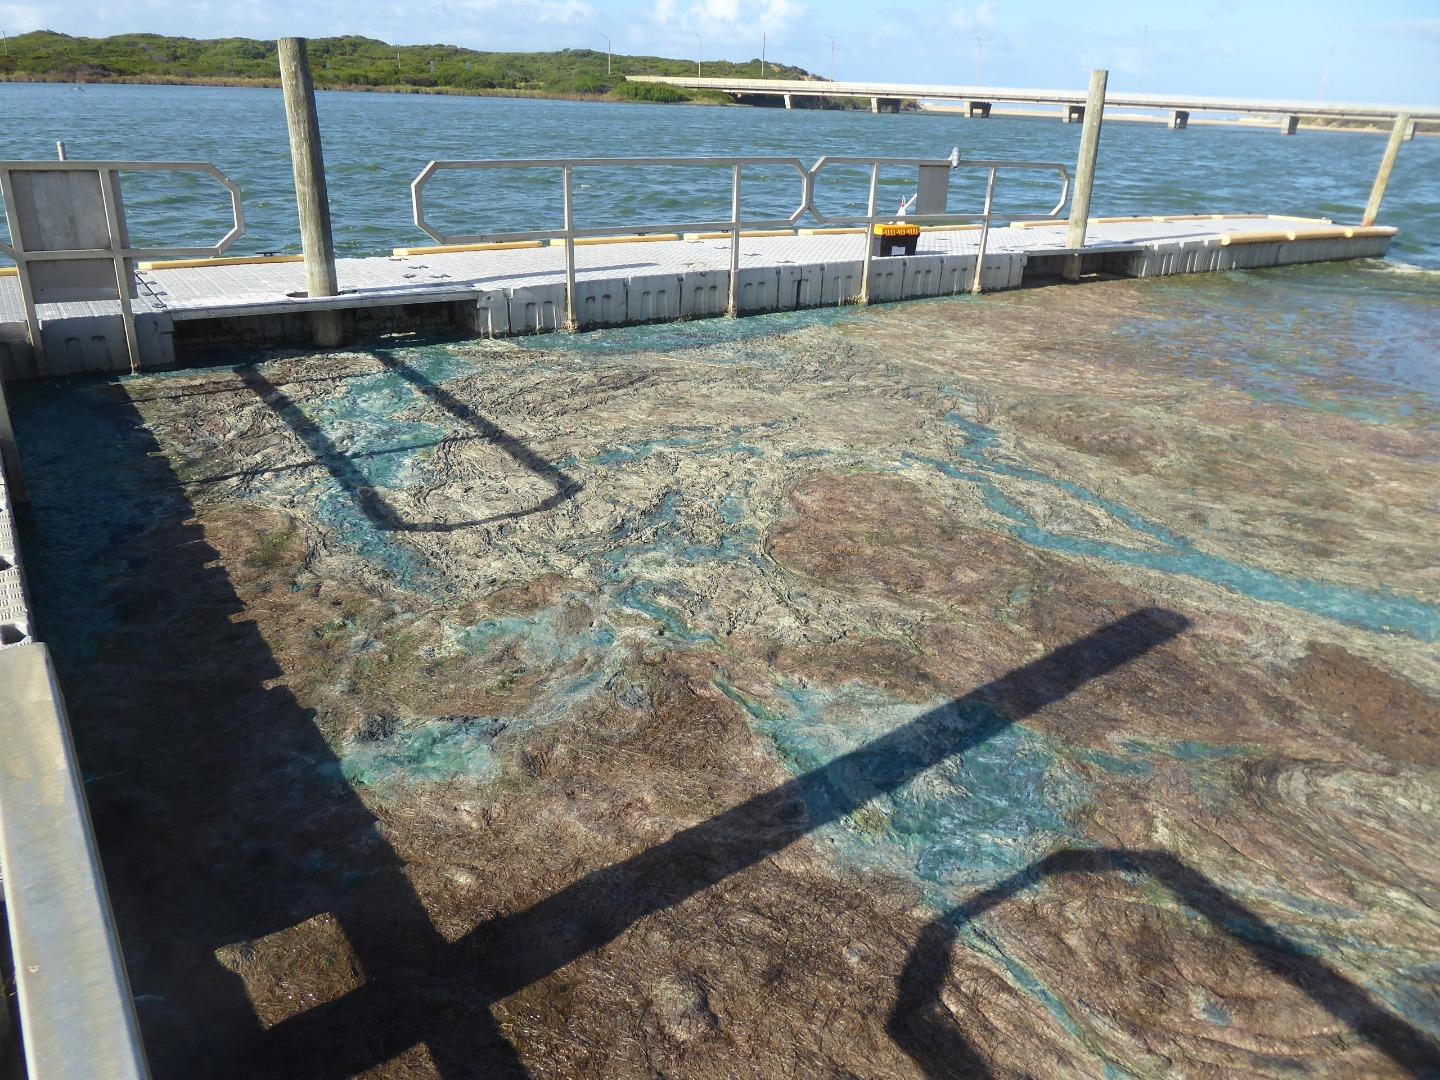
The water at the Curdies Estuary is putrid with Blue Green Algae, to the extent that the surface is coated in a thick scum close to the shore.. The water is like pea soup over the entire depth, but the smell is more like an open cesspit.
The Caravan Park adjacent to the river is constantly getting cancellations because the tourists cannot stand the terrible smell. Local resicdents are also complaining about the terrible smell.
|
|
Depth
|
Turb NTU
|
pH
|
Temp ° C
|
Salin ppt
|
D.O. mg/L
|
D.O. % sat
|
EC mS/cm
|
|
0.1m
|
150.0 |
8.5 |
12.20 |
|
1.93 |
17.9 |
17.25 |
|
2.4m
|
150.0 |
8.7 |
14.20 |
|
0.10 |
1.0 |
32.60 |
|
| #14051
|
9 Apr 2021
|
Approved |
Notes:
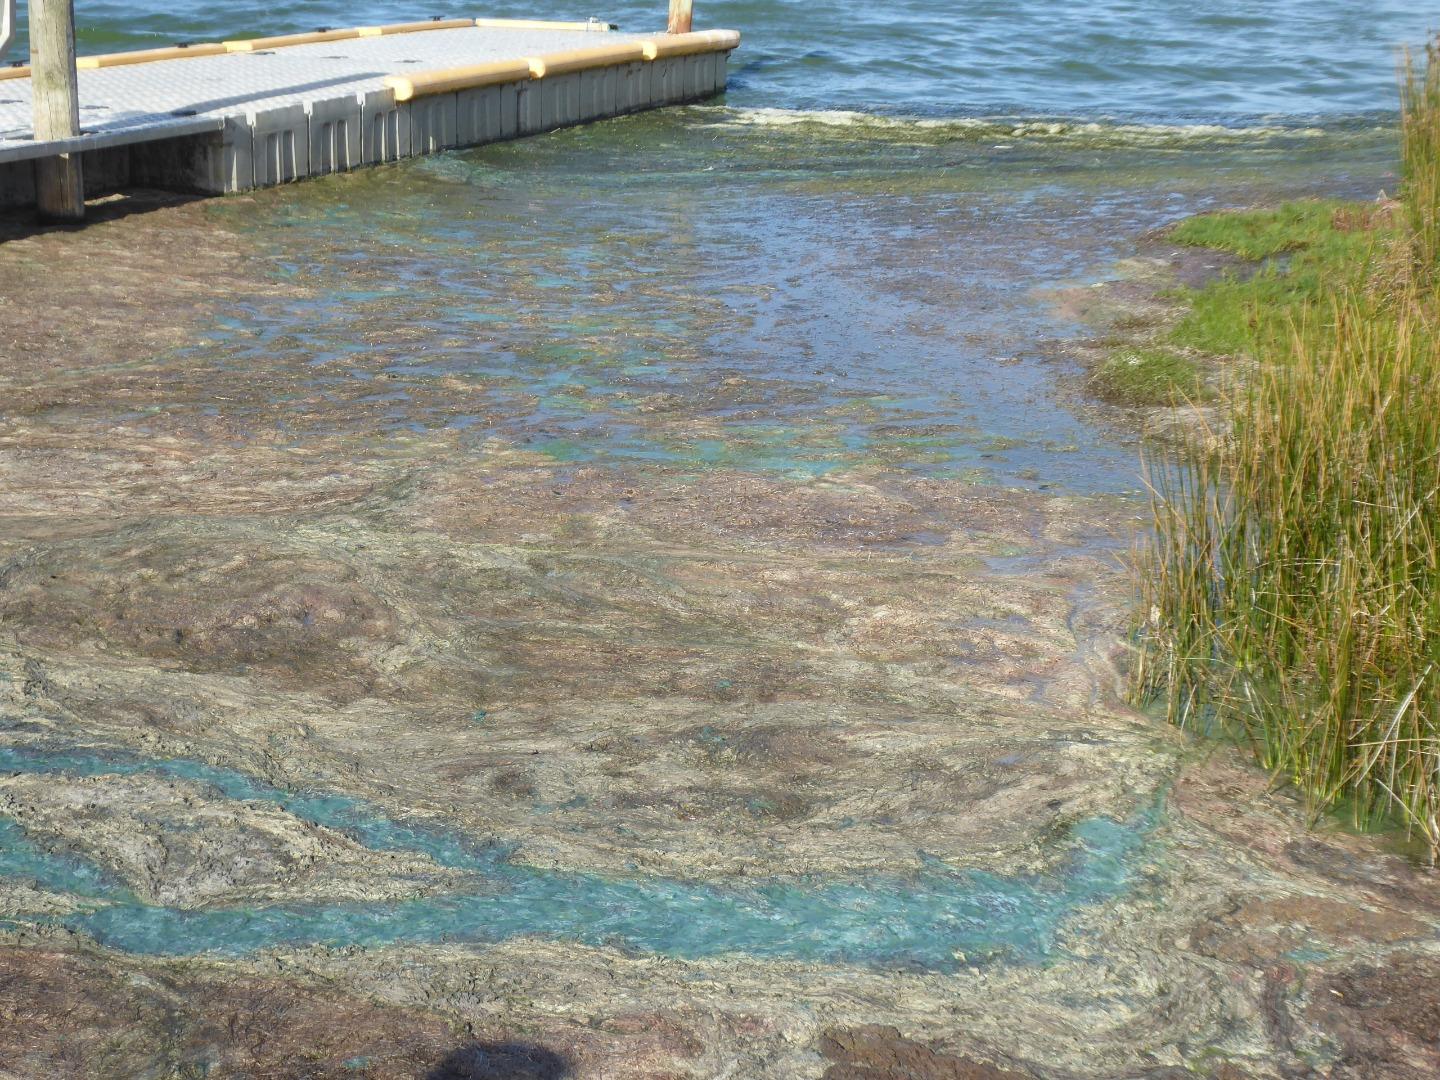
The river was putrid with Blue-Green Algae.
Sludge was backed up around the boat ramp, between the pontoon and the shore, and up onto the shore in most areas.
The smell was disgusting, an obvious health hazard.
Where the sludge was not present, the water was more like soup.
|
|
Depth
|
Turb NTU
|
pH
|
Temp ° C
|
Salin ppt
|
D.O. mg/L
|
D.O. % sat
|
EC mS/cm
|
|
0.1m
|
75.0 |
9.5 |
15.70 |
10.00 |
5.02 |
54.0 |
13.90 |
|
2.1m
|
75.0 |
9.2 |
15.80 |
10.00 |
4.96 |
52.3 |
16.89 |
|
| #13998
|
2 Mar 2021
|
Approved |
|
|
Depth
|
Turb NTU
|
pH
|
Temp ° C
|
Salin ppt
|
D.O. mg/L
|
D.O. % sat
|
EC mS/cm
|
|
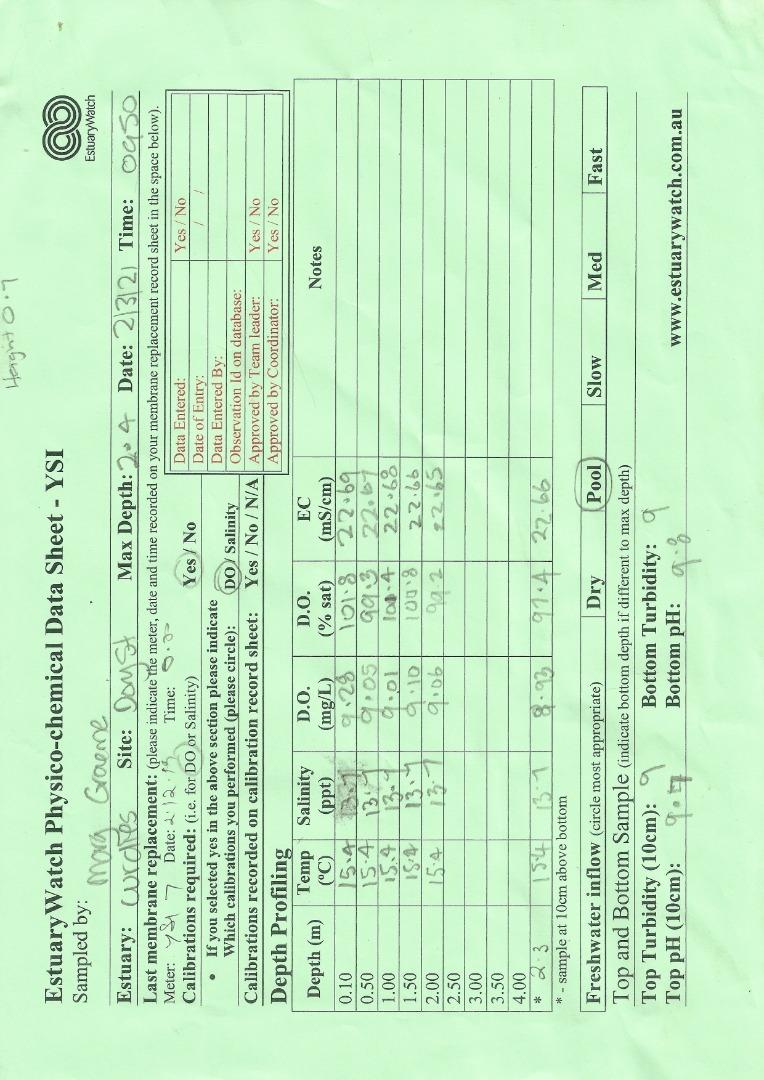
0.1m
|
9.0 |
9.7 |
15.40 |
13.70 |
9.28 |
101.8 |
22.69 |
|
2.3m
|
9.0 |
9.8 |
15.40 |
13.70 |
8.93 |
97.4 |
22.66 |
|
| #13969
|
2 Feb 2021
|
Approved |
Notes:
The pH readings taken were considered high, so the meter was re-calibrated and new samples re-tested, with identical results
|
|
Depth
|
Turb NTU
|
pH
|
Temp ° C
|
Salin ppt
|
D.O. mg/L
|
D.O. % sat
|
EC mS/cm
|
|
0.1m
|
9.0 |
9.4 |
18.40 |
16.70 |
7.24 |
86.0 |
27.18 |
|
2.3m
|
9.0 |
9.5 |
18.30 |
16.80 |
6.64 |
80.3 |
27.37 |
|
| #13919
|
5 Jan 2021
|
Approved |
|
|
Depth
|
Turb NTU
|
pH
|
Temp ° C
|
Salin ppt
|
D.O. mg/L
|
D.O. % sat
|
EC mS/cm
|
|
0.1m
|
9.0 |
8.6 |
16.20 |
26.80 |
7.43 |
89.8 |
41.74 |
|
2.0m
|
9.0 |
8.5 |
17.70 |
31.10 |
5.75 |
68.6 |
47.78 |
|
| #13885
|
1 Dec 2020
|
Approved |
|
|
Depth
|
Turb NTU
|
pH
|
Temp ° C
|
Salin ppt
|
D.O. mg/L
|
D.O. % sat
|
EC mS/cm
|
|
0.1m
|
9.0 |
8.1 |
17.90 |
27.30 |
8.13 |
101.0 |
42.20 |
|
1.9m
|
9.0 |
8.0 |
16.60 |
34.00 |
7.55 |
95.0 |
54.40 |
|
| #13811
|
6 Oct 2020
|
Approved |
|
|
Depth
|
Turb NTU
|
pH
|
Temp ° C
|
Salin ppt
|
D.O. mg/L
|
D.O. % sat
|
EC mS/cm
|
|
0.1m
|
35.0 |
6.6 |
12.50 |
3.80 |
9.15 |
91.2 |
6.80 |
|
1.7m
|
35.0 |
7.3 |
12.10 |
4.20 |
9.04 |
88.0 |
7.56 |
|
| #13780
|
1 Sep 2020
|
Approved |
|
|
Depth
|
Turb NTU
|
pH
|
Temp ° C
|
Salin ppt
|
D.O. mg/L
|
D.O. % sat
|
EC mS/cm
|
|
0.1m
|
9.0 |
8.2 |
11.50 |
24.70 |
8.40 |
89.2 |
37.22 |
|
1.7m
|
9.0 |
8.3 |
12.90 |
34.30 |
7.67 |
90.6 |
52.20 |
|
| #13769
|
6 Aug 2020
|
Approved |
Notes:
The LaquaTwin pH meter failed calibration several tlmes..
Calibration results were: -
pH 7 12.4
pH 4 11.2
|
|
Depth
|
Turb NTU
|
pH
|
Temp ° C
|
Salin ppt
|
D.O. mg/L
|
D.O. % sat
|
EC mS/cm
|
|
0.1m
|
9.0 |
|
9.80 |
24.50 |
10.16 |
102.5 |
38.80 |
|
2.0m
|
9.0 |
|
11.90 |
33.30 |
7.89 |
89.3 |
50.80 |
|
| #13739
|
7 Jul 2020
|
Approved |
Notes:
The pH meter readings must be considered suspect.- data removed
|
|
Depth
|
Turb NTU
|
pH
|
Temp ° C
|
Salin ppt
|
D.O. mg/L
|
D.O. % sat
|
EC mS/cm
|
|
0.1m
|
33.0 |
7.4 |
10.70 |
4.60 |
9.02 |
83.4 |
8.31 |
|
1.5m
|
33.0 |
|
10.70 |
4.60 |
8.08 |
71.4 |
8.32 |
|
| #13719
|
2 Jun 2020
|
Approved |
Notes:
pH readings could not be taken because when we were calibrating the meter, the results fluctuated, and error message E3 and E$came up.
We had requested repair or replacement of ths meter some months ago.
|
|
Depth
|
Turb NTU
|
pH
|
Temp ° C
|
Salin ppt
|
D.O. mg/L
|
D.O. % sat
|
EC mS/cm
|
|
0.1m
|
11.0 |
|
11.00 |
28.40 |
8.74 |
94.1 |
44.21 |
|
2.0m
|
11.0 |
|
12.20 |
31.40 |
7.67 |
88.6 |
48.18 |
|
| #13604
|
3 Mar 2020
|
Approved |
Notes:
Ph readings could not be taken because the Ph meter could not be calibrated.
|
|
Depth
|
Turb NTU
|
pH
|
Temp ° C
|
Salin ppt
|
D.O. mg/L
|
D.O. % sat
|
EC mS/cm
|
|
0.1m
|
9.0 |
|
17.10 |
4.30 |
8.95 |
95.2 |
7.67 |
|
2.4m
|
9.0 |
|
17.20 |
4.30 |
8.57 |
91.3 |
7.66 |
|
| #13556
|
4 Feb 2020
|
Approved |
Notes:
We did not monitor the site at Curdie Vale because the monitoring site was under water
|
|
Depth
|
Turb NTU
|
pH
|
Temp ° C
|
Salin ppt
|
D.O. mg/L
|
D.O. % sat
|
EC mS/cm
|
|
0.1m
|
9.0 |
8.6 |
17.20 |
4.30 |
8.14 |
87.2 |
7.80 |
|
2.5m
|
9.0 |
8.7 |
17.00 |
4.30 |
7.65 |
80.1 |
7.80 |
|
| #13486
|
7 Jan 2020
|
Approved |
|
|
Depth
|
Turb NTU
|
pH
|
Temp ° C
|
Salin ppt
|
D.O. mg/L
|
D.O. % sat
|
EC mS/cm
|
|
0.1m
|
9.0 |
8.5 |
19.40 |
4.50 |
8.83 |
98.3 |
8.02 |
|
2.6m
|
9.0 |
8.7 |
19.50 |
4.50 |
8.39 |
92.1 |
8.15 |
|
| #13442
|
3 Dec 2019
|
Approved |
|
|
Depth
|
Turb NTU
|
pH
|
Temp ° C
|
Salin ppt
|
D.O. mg/L
|
D.O. % sat
|
EC mS/cm
|
|
0.1m
|
9.0 |
7.9 |
13.90 |
4.80 |
8.92 |
88.4 |
8.64 |
|
2.6m
|
9.0 |
8.1 |
13.70 |
4.90 |
8.80 |
88.1 |
8.70 |
|
| #13388
|
5 Nov 2019
|
Approved |
|
|
Depth
|
Turb NTU
|
pH
|
Temp ° C
|
Salin ppt
|
D.O. mg/L
|
D.O. % sat
|
EC mS/cm
|
|
0.1m
|
9.0 |
8.4 |
12.50 |
13.40 |
8.36 |
89.5 |
22.25 |
|
1.8m
|
9.0 |
8.0 |
15.70 |
31.00 |
6.58 |
79.1 |
47.52 |
|
| #13347
|
1 Oct 2019
|
Approved |
|
|
Depth
|
Turb NTU
|
pH
|
Temp ° C
|
Salin ppt
|
D.O. mg/L
|
D.O. % sat
|
EC mS/cm
|
|
0.1m
|
9.0 |
8.5 |
12.70 |
4.60 |
12.35 |
120.6 |
8.21 |
|
1.6m
|
9.0 |
8.0 |
13.50 |
32.90 |
7.35 |
86.5 |
50.20 |
|