EstuaryWatch Data Portal
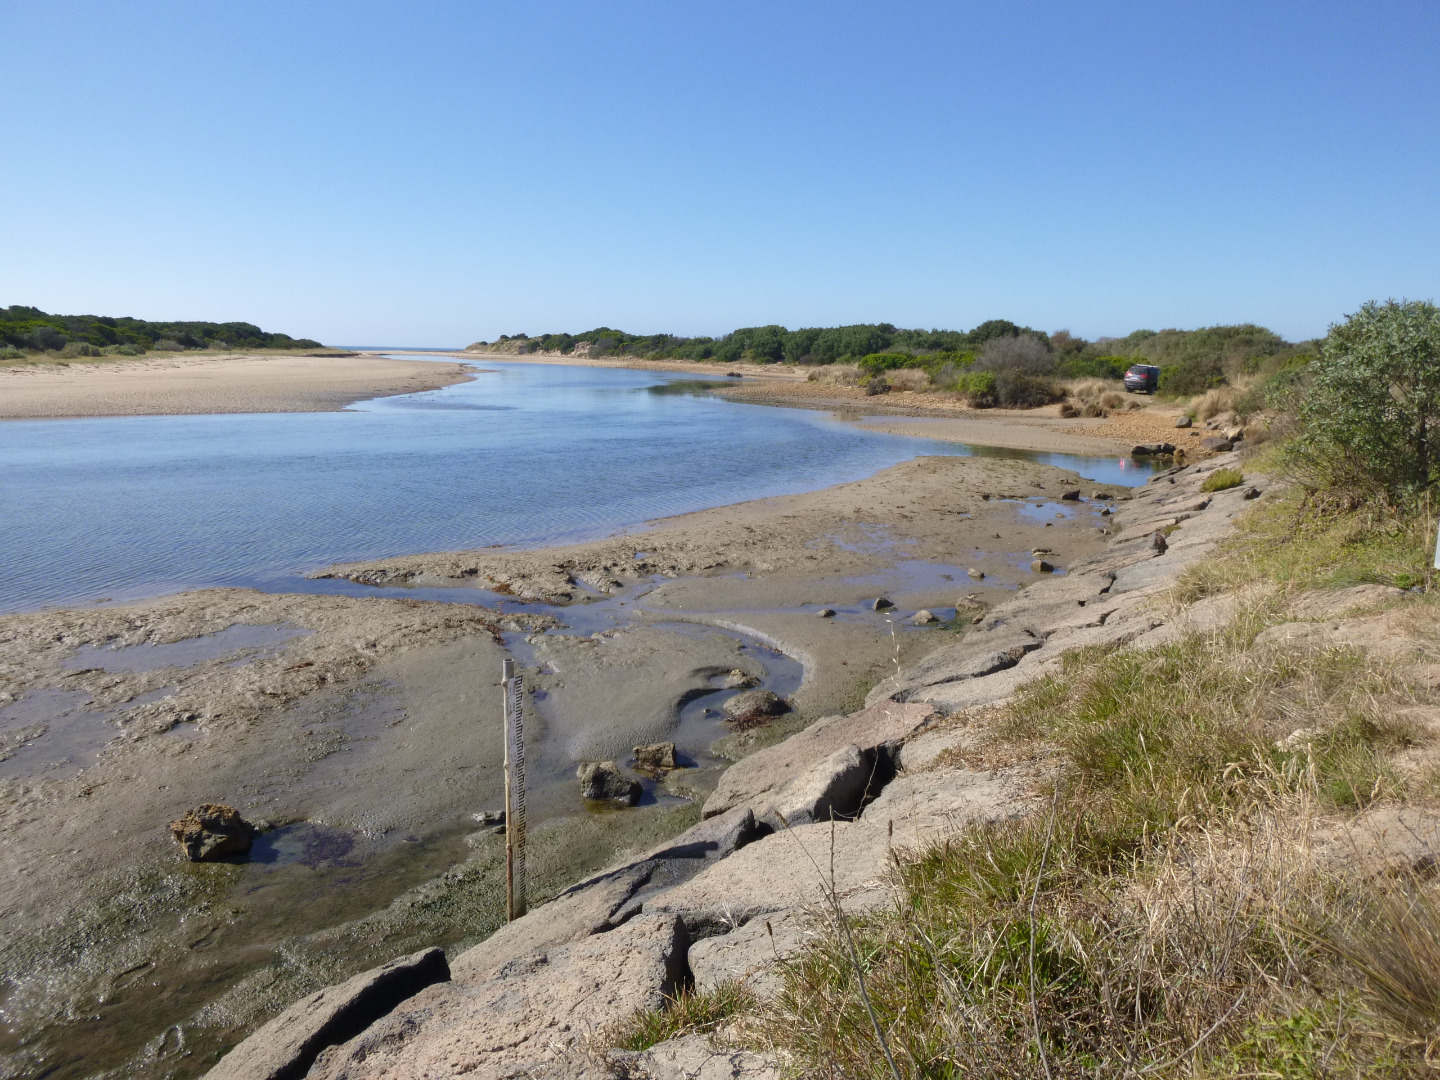
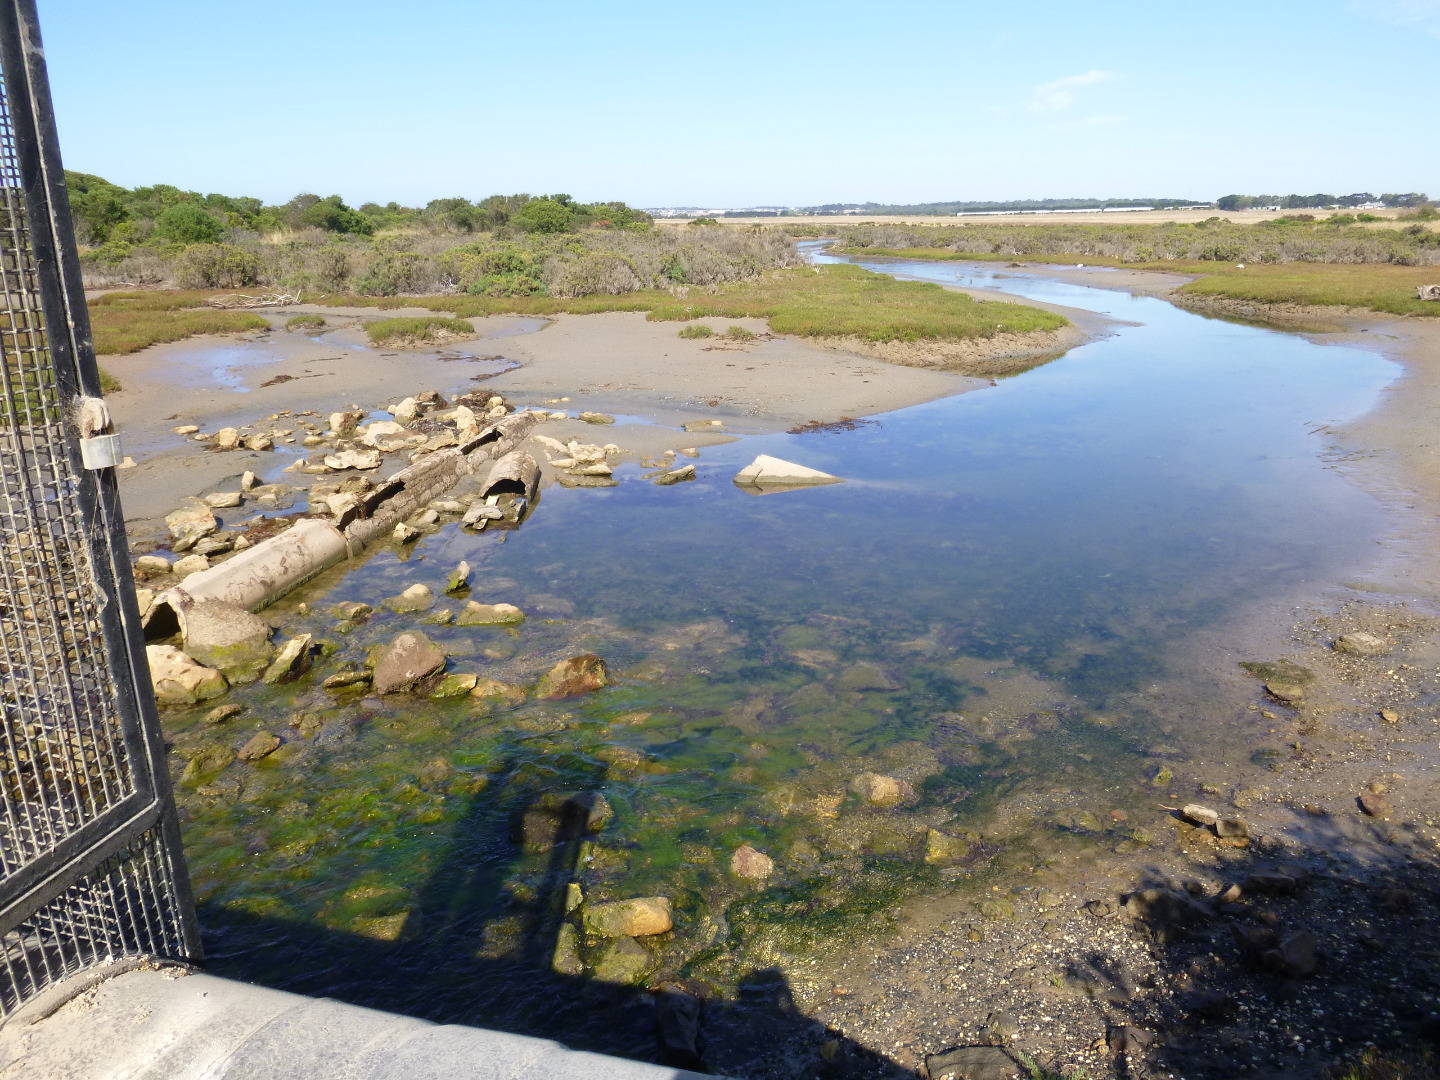
T1 Point Impossible Road Culvert at Mullet Creek
Active Physico-Chemical 17-10-2014 - 16-07-2023Thompson Creek Estuary
| ID | Date | Status | Details | ||||||||||||||||||||||||||
|---|---|---|---|---|---|---|---|---|---|---|---|---|---|---|---|---|---|---|---|---|---|---|---|---|---|---|---|---|---|
| #12556 | 30 Sep 2017 | Approved |
|
||||||||||||||||||||||||||
|
|||||||||||||||||||||||||||||
| #11416 | 23 Aug 2017 | Approved |
Notes:
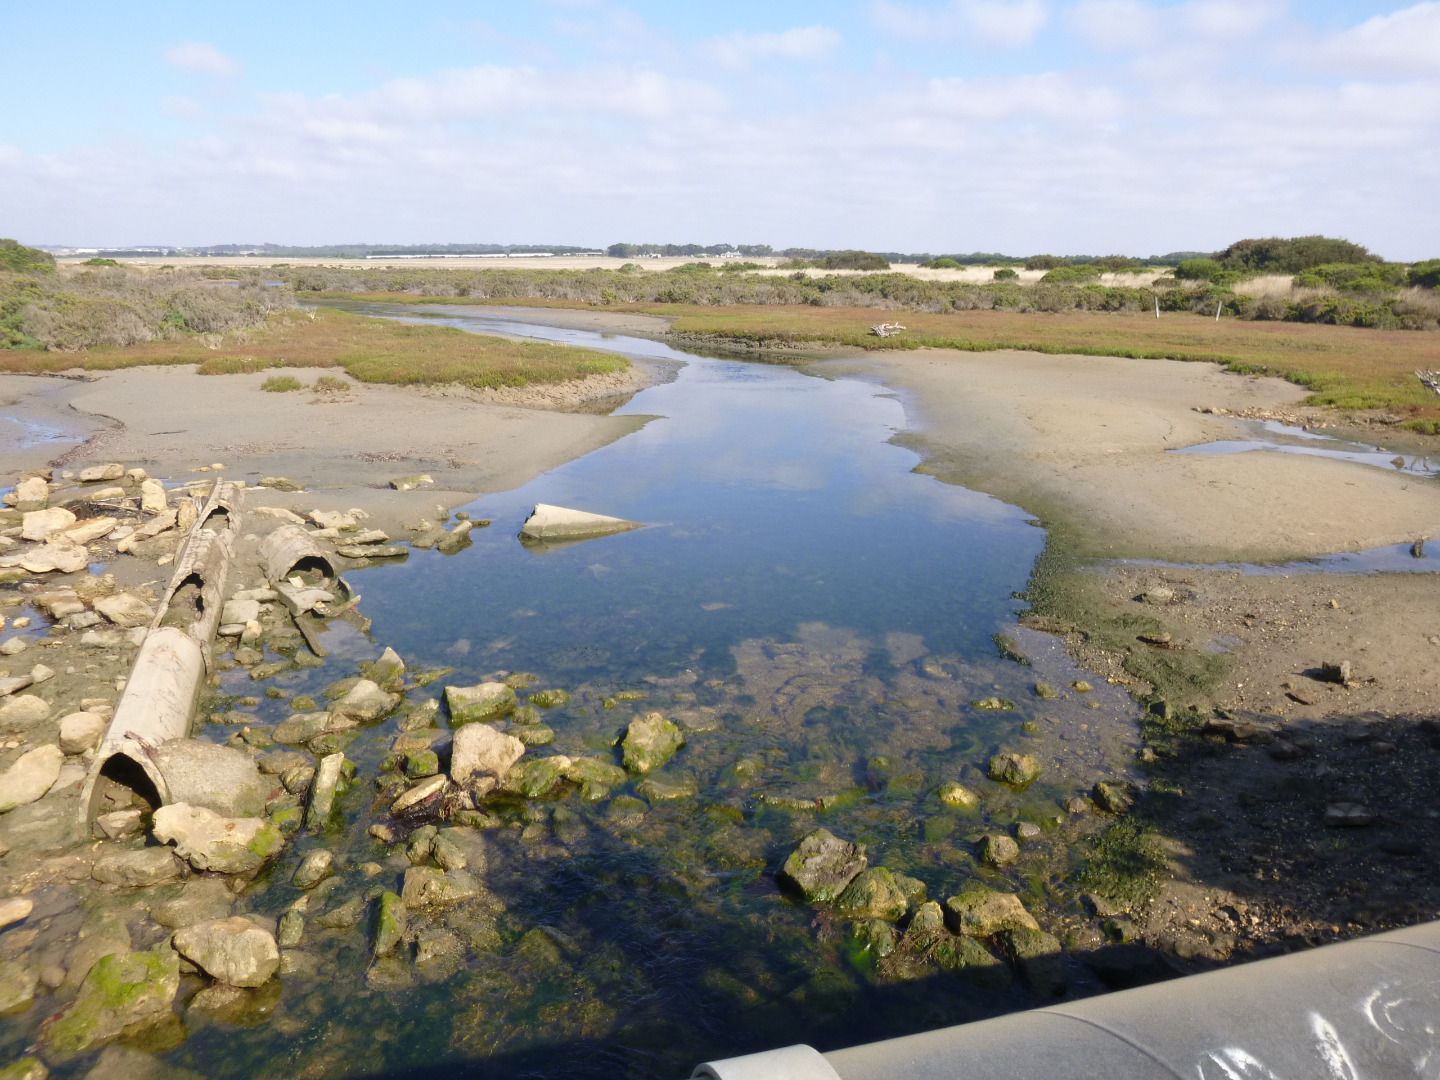
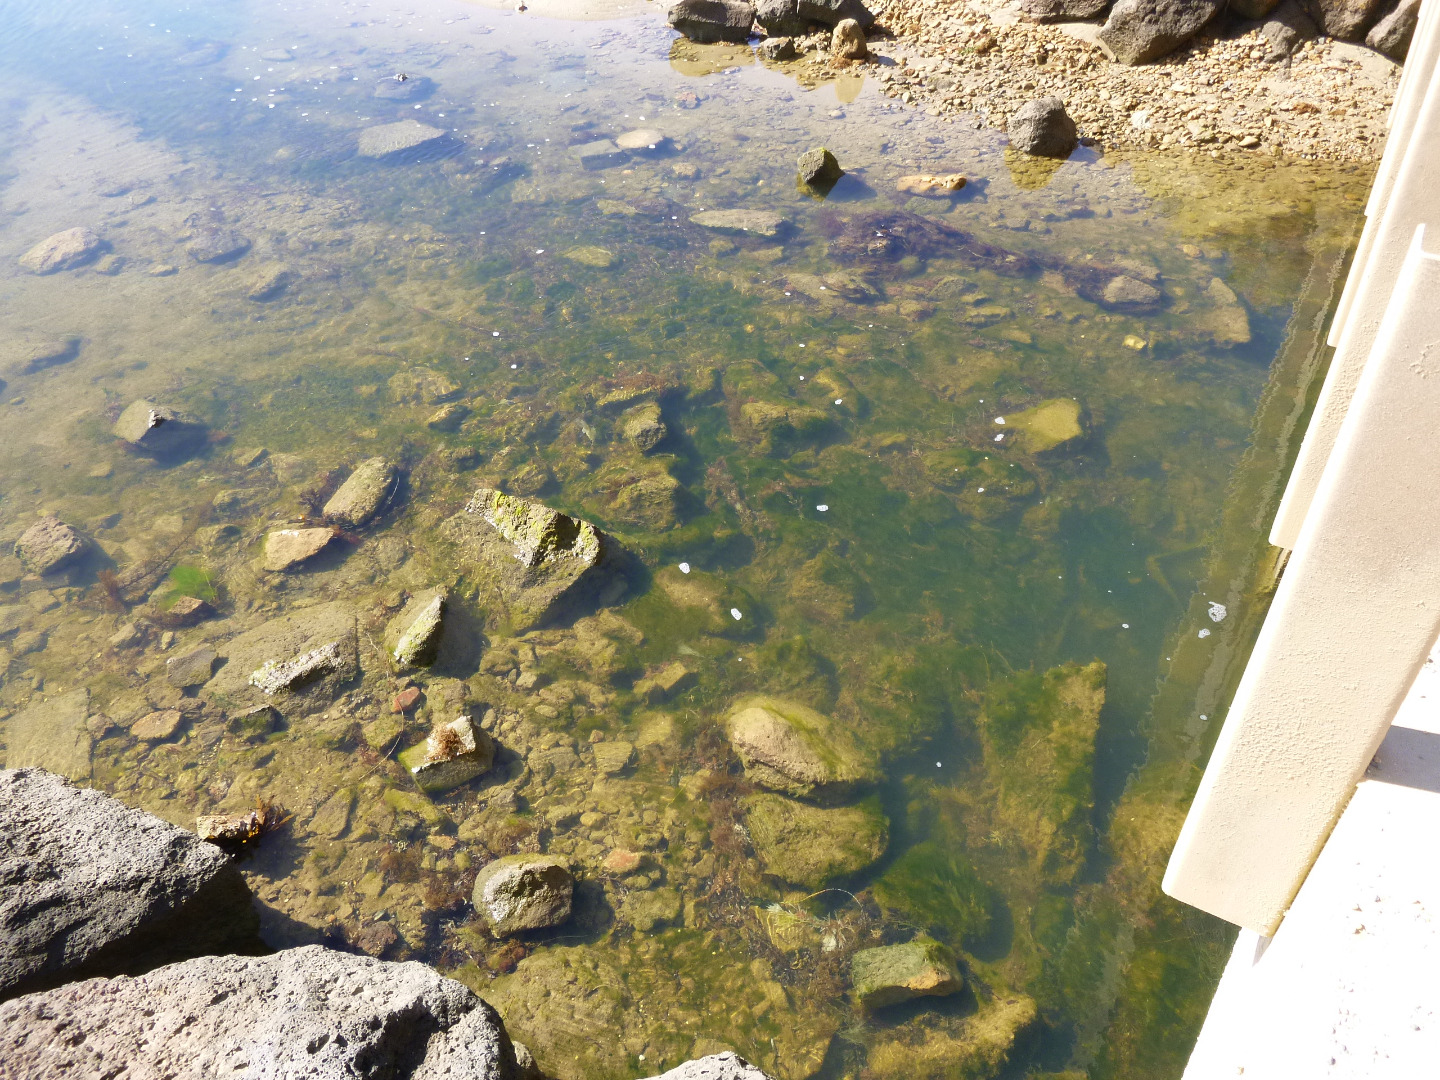
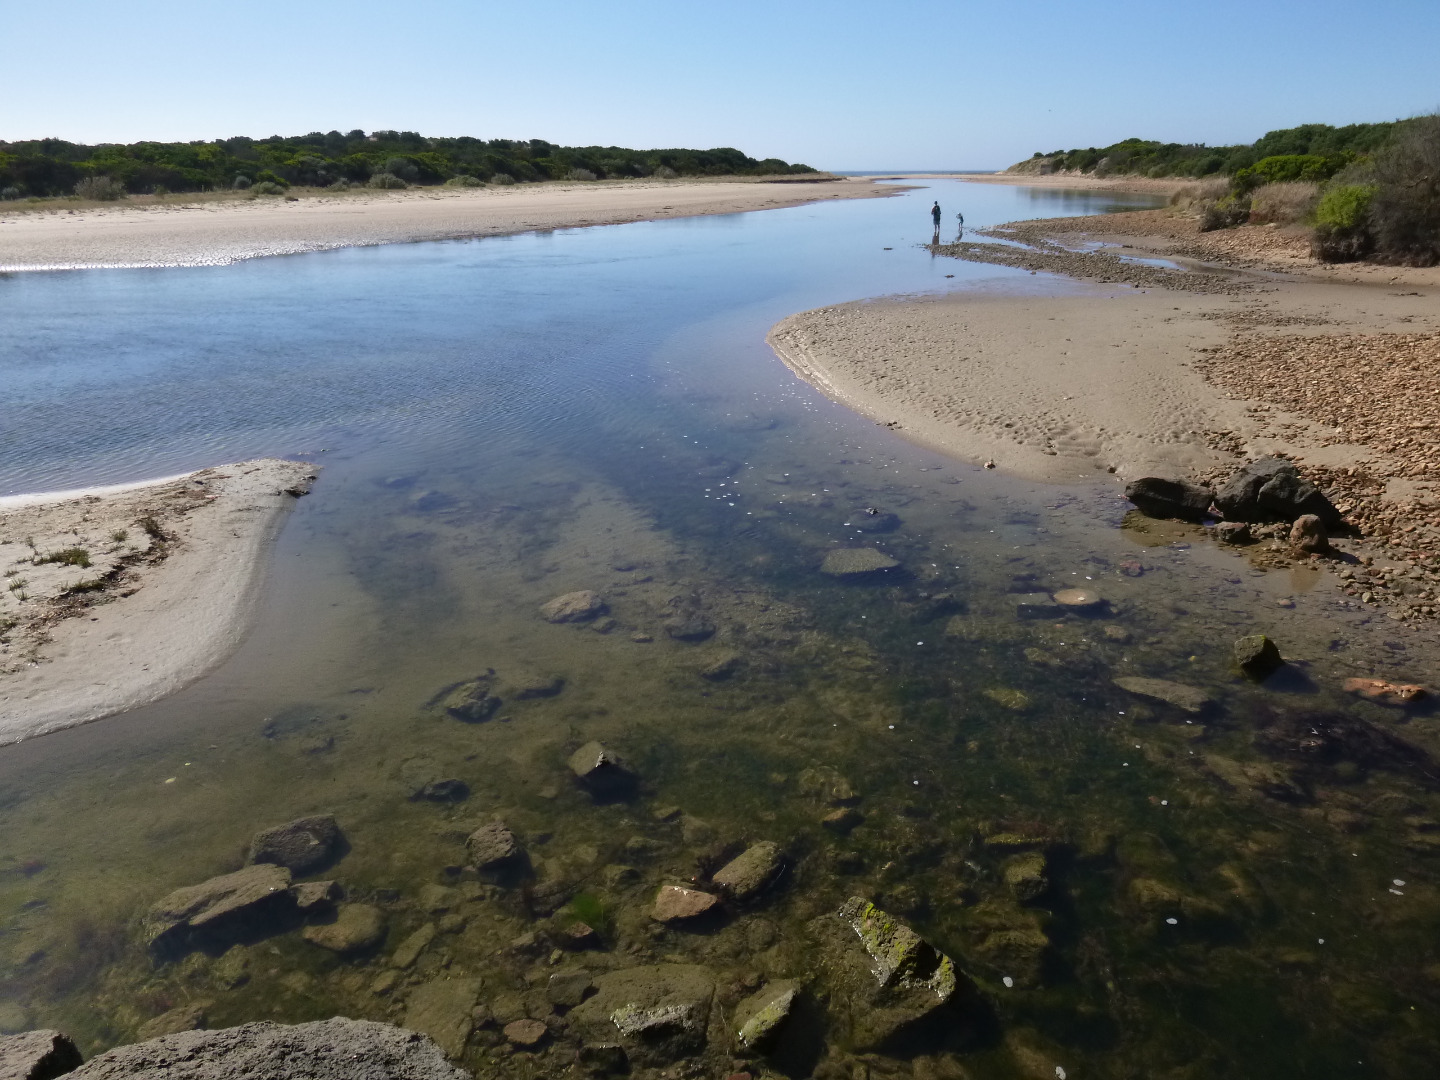
- Flow is coming in from the ocean and going up stream. - Surface film of algae + pollen. - Allyson O'Brien from The University of Melbourne present collecting eDNA samples. |
||||||||||||||||||||||||||
|
|||||||||||||||||||||||||||||
| #11373 | 31 Jul 2017 | Approved |
Notes:
1. Surface foam patches running from Mullet Creek 2. Low level odour 3. Possible run off from recent rains 4. New batteries for these readings |
||||||||||||||||||||||||||
|
|||||||||||||||||||||||||||||
| #11358 | 24 Jun 2017 | Approved |
Notes:
quite strong incoming tide made measurements difficult king tide (new moon) 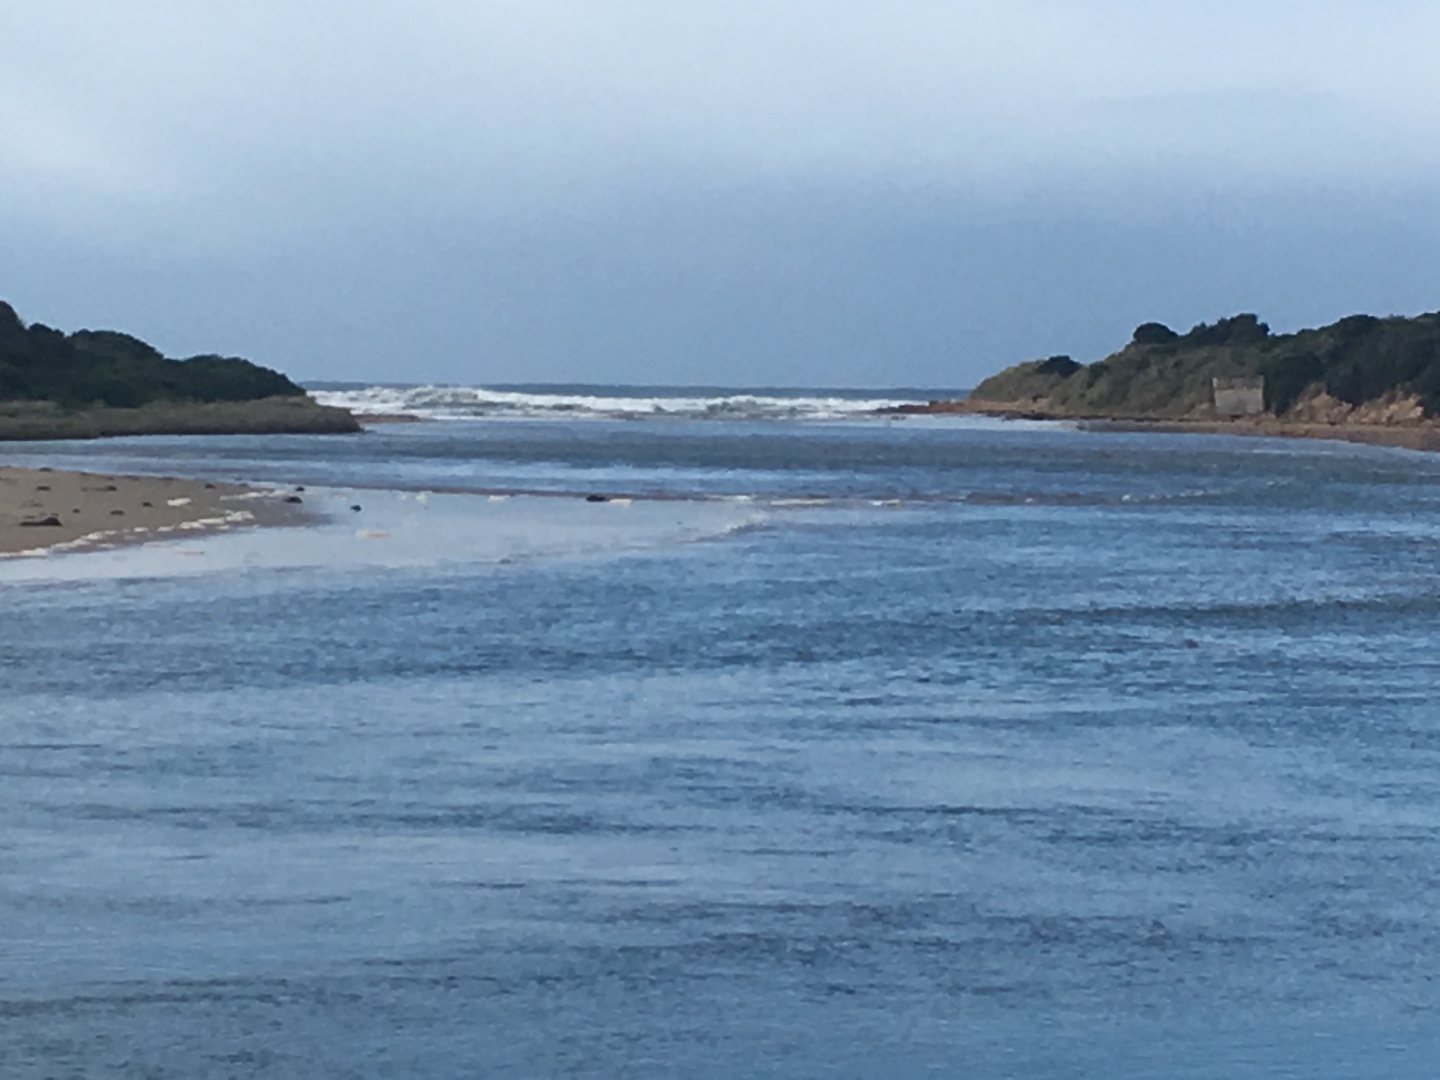 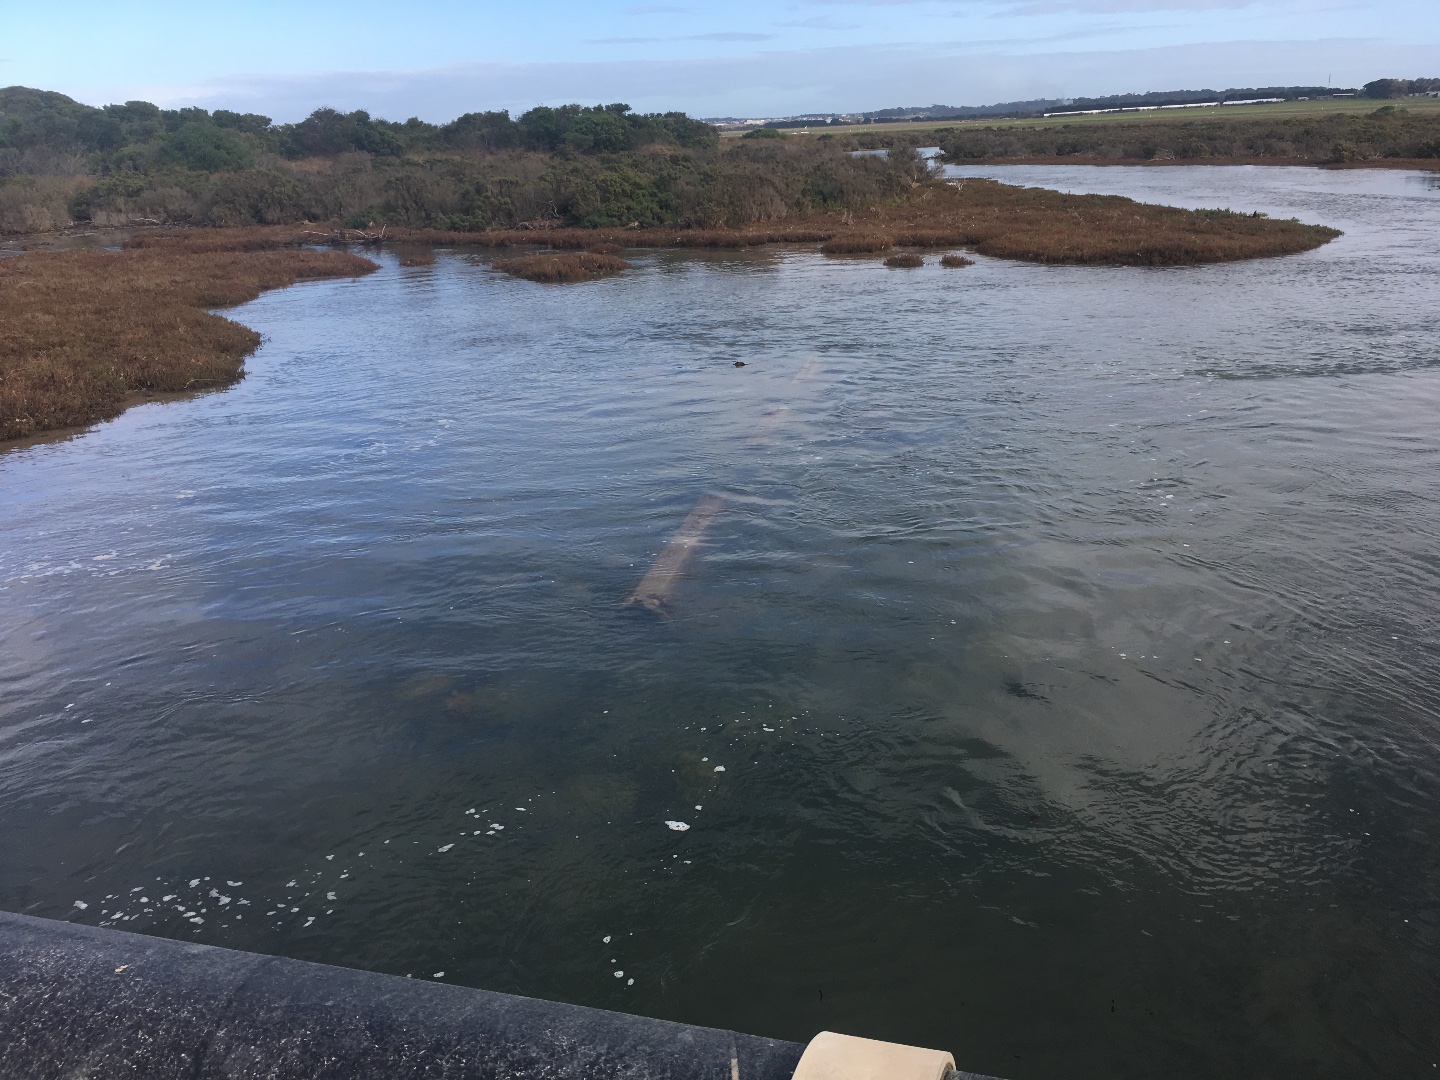 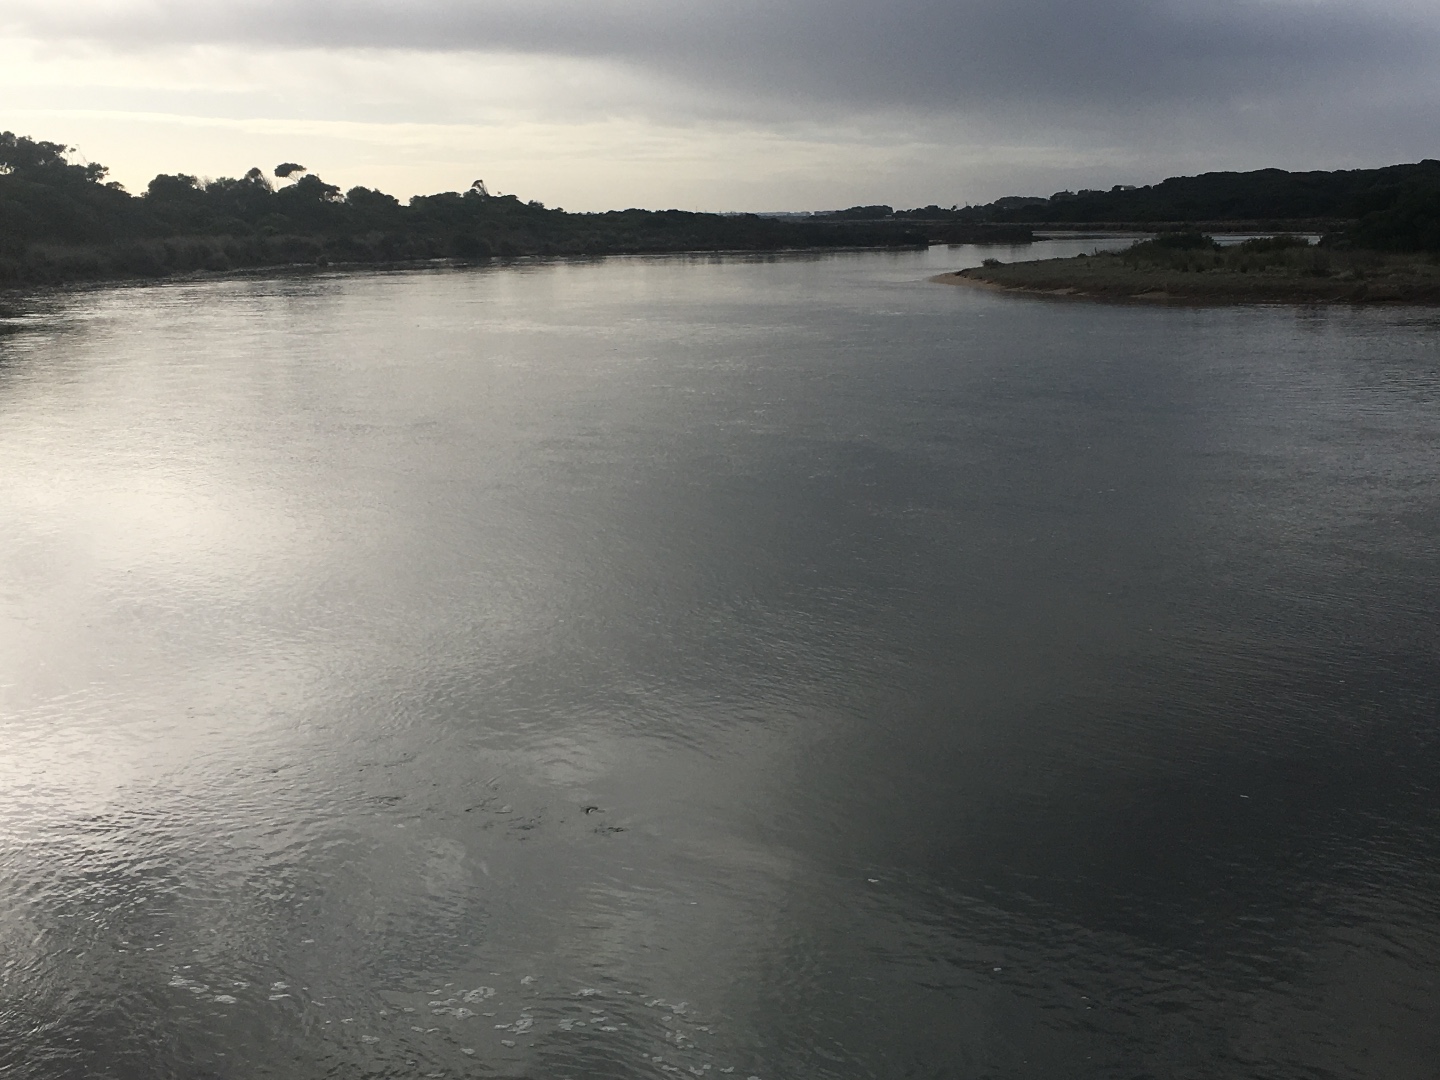 |
||||||||||||||||||||||||||
|
|||||||||||||||||||||||||||||
| #11270 | 27 May 2017 | Approved |
Notes:
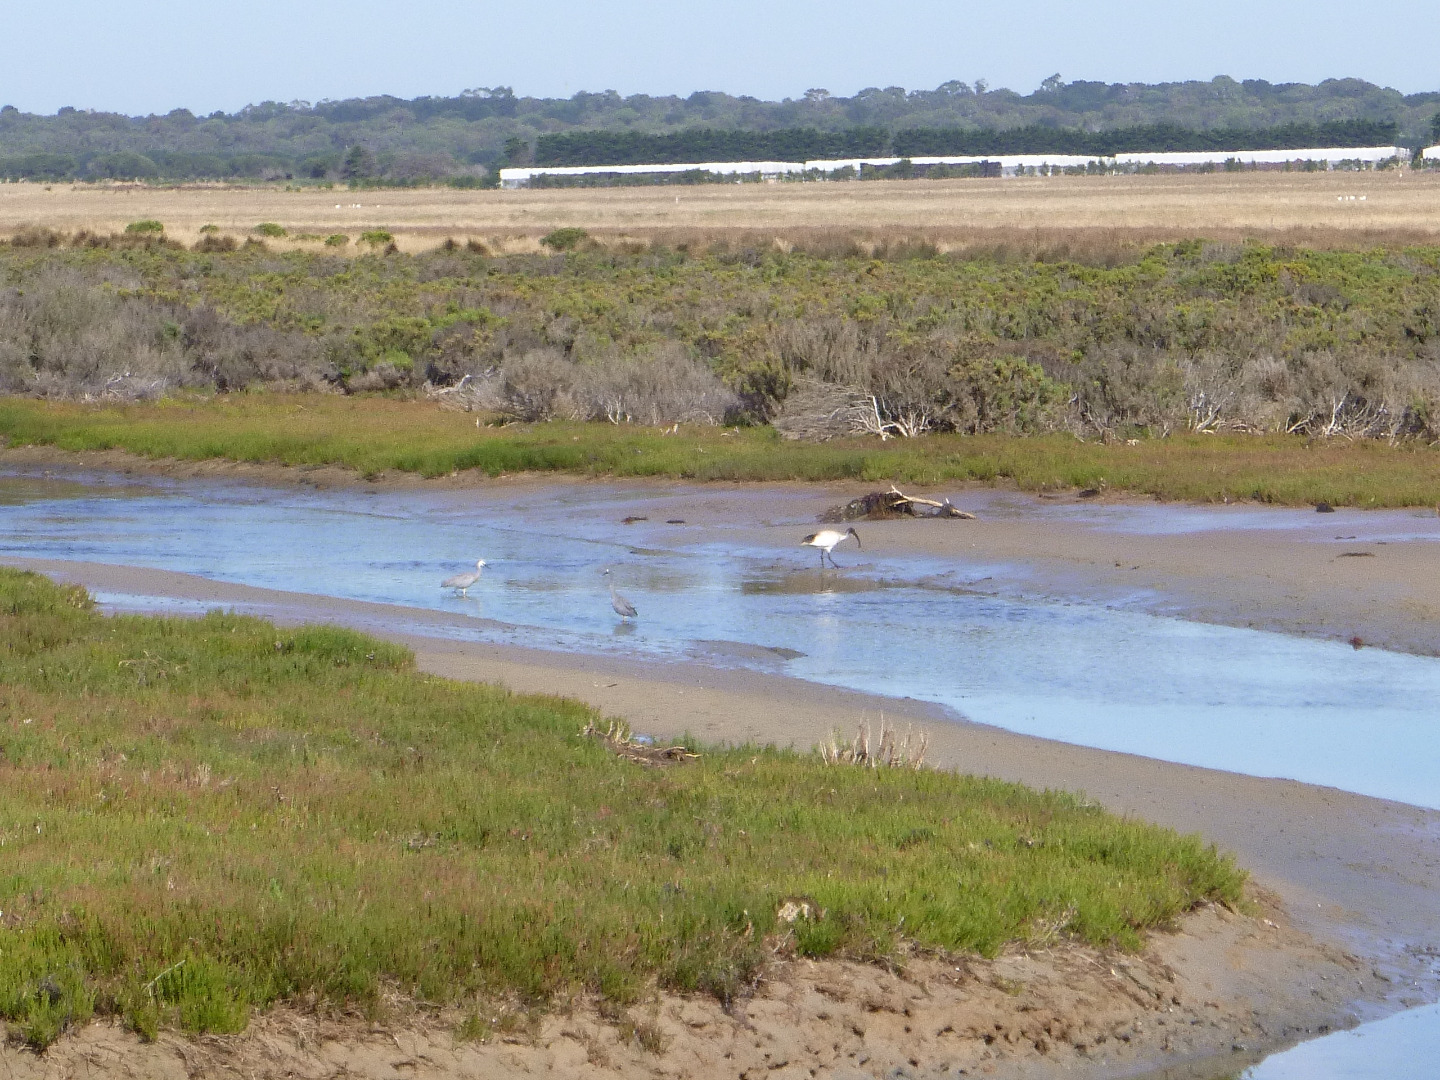
tidal waves were entering as readings were taken white great egret was spotted on the rocky shelf just up from bridge two ibis were spotted on the other side of bridge |
||||||||||||||||||||||||||
|
|||||||||||||||||||||||||||||
| #11022 | 25 Mar 2017 | Approved |
Notes:
do not know if the hach metre was calibrated properly It has been a while since Roland had calibrated it 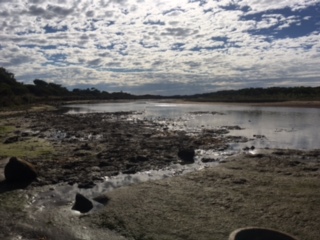 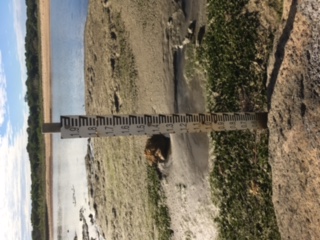  |
||||||||||||||||||||||||||
|
|||||||||||||||||||||||||||||
| #10884 | 4 Mar 2017 | Approved |
Notes:
      |
||||||||||||||||||||||||||
|
|||||||||||||||||||||||||||||
| #10787 | 4 Feb 2017 | Approved |
Notes:
     |
||||||||||||||||||||||||||
|
|||||||||||||||||||||||||||||
| #10736 | 26 Nov 2016 | Pending |
Notes:
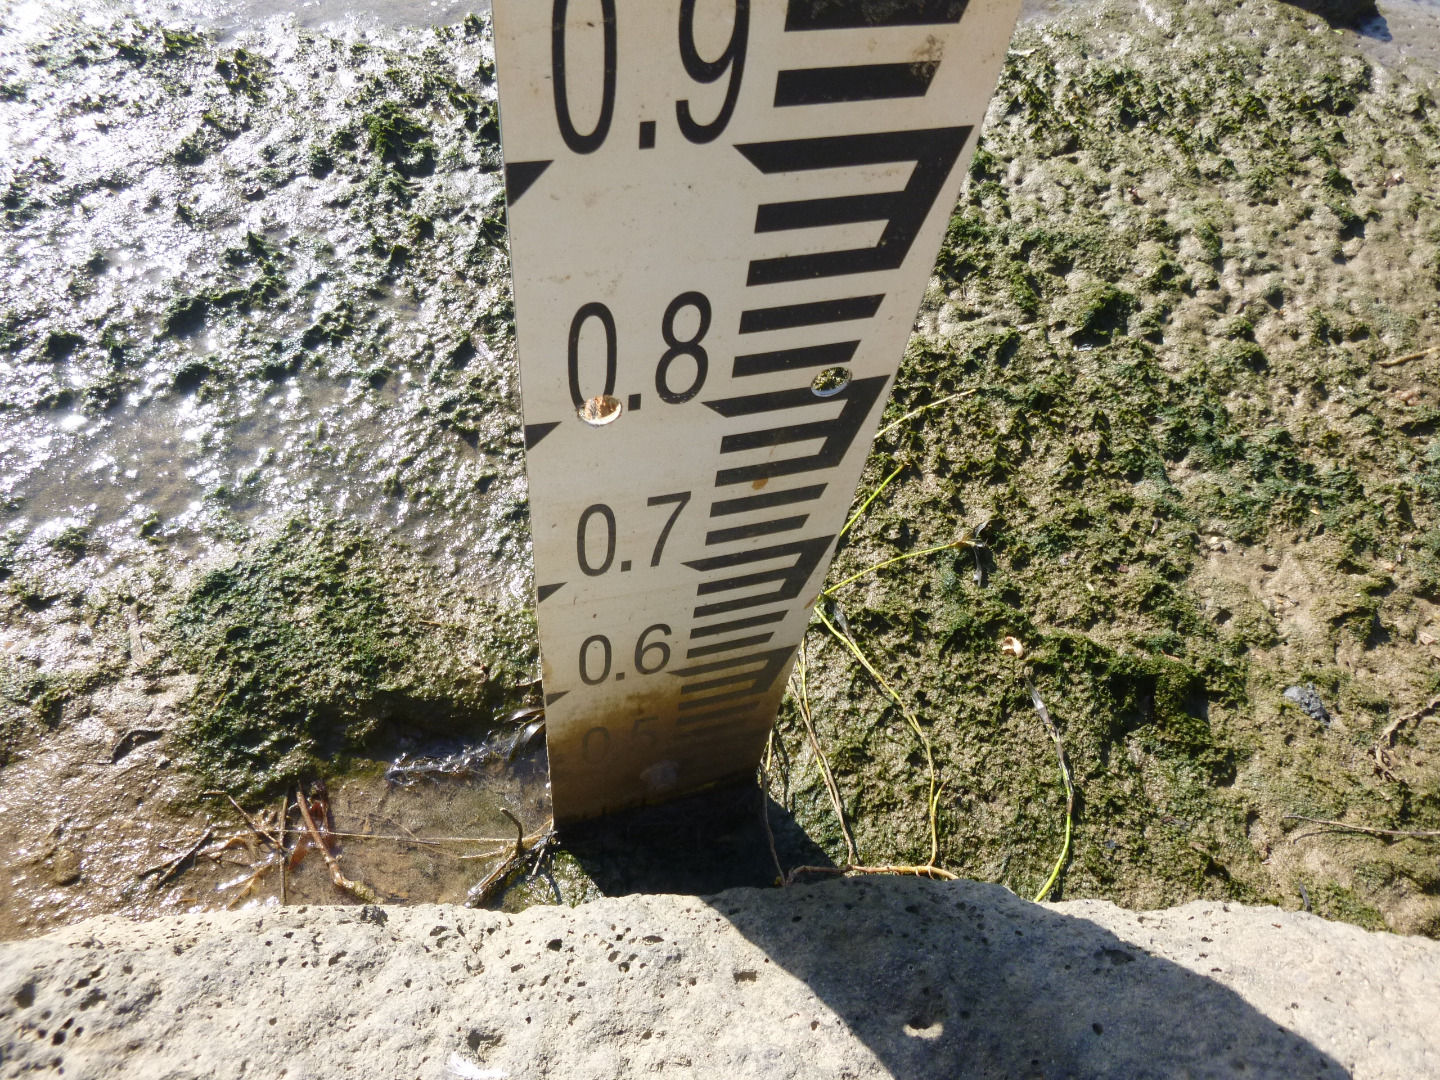
1. Filament algae lots 2. Noticeable tidal flow in and out 3.Guage board height 5.2 AHD |
||||||||||||||||||||||||||
|
|||||||||||||||||||||||||||||
| #10430 | 27 Jul 2016 | Approved |
Notes:
1. Height on gauge board 1.42 m |
||||||||||||||||||||||||||
|
|||||||||||||||||||||||||||||

All content, files, data and images provided by the EstuaryWatch Data Portal and Gallery are subject to a Creative Commons Attribution License
Content is made available to be used in any way, and should always attribute EstuaryWatch and www.estuarywatch.org.au