EstuaryWatch Data Portal
T1 Point Impossible Road Culvert at Mullet Creek
Site details
Overview
| Estuary | Thompson Creek Estuary |
|---|---|
| CMA | Corangamite CMA |
| Type | Physico-Chemical |
| Site code | T1 |
| Site name | Point Impossible Road Culvert at Mullet Creek |
| Nearest road and town | Breamlea. Point Impossible Road |
| Description | Site is on the side of the culvert where Mullet Creek enters Thompson Creek estuary. |
| Site access | Drive along Point Impossible Road towards the beach. Park in the pullover before the road bridge/culvert. Walk across rocks to the side of the culvert. |
| Land use |
|
| Land use description | |
| Status | Active |
| Observation history | 17-10-2014 - 16-07-2023 |
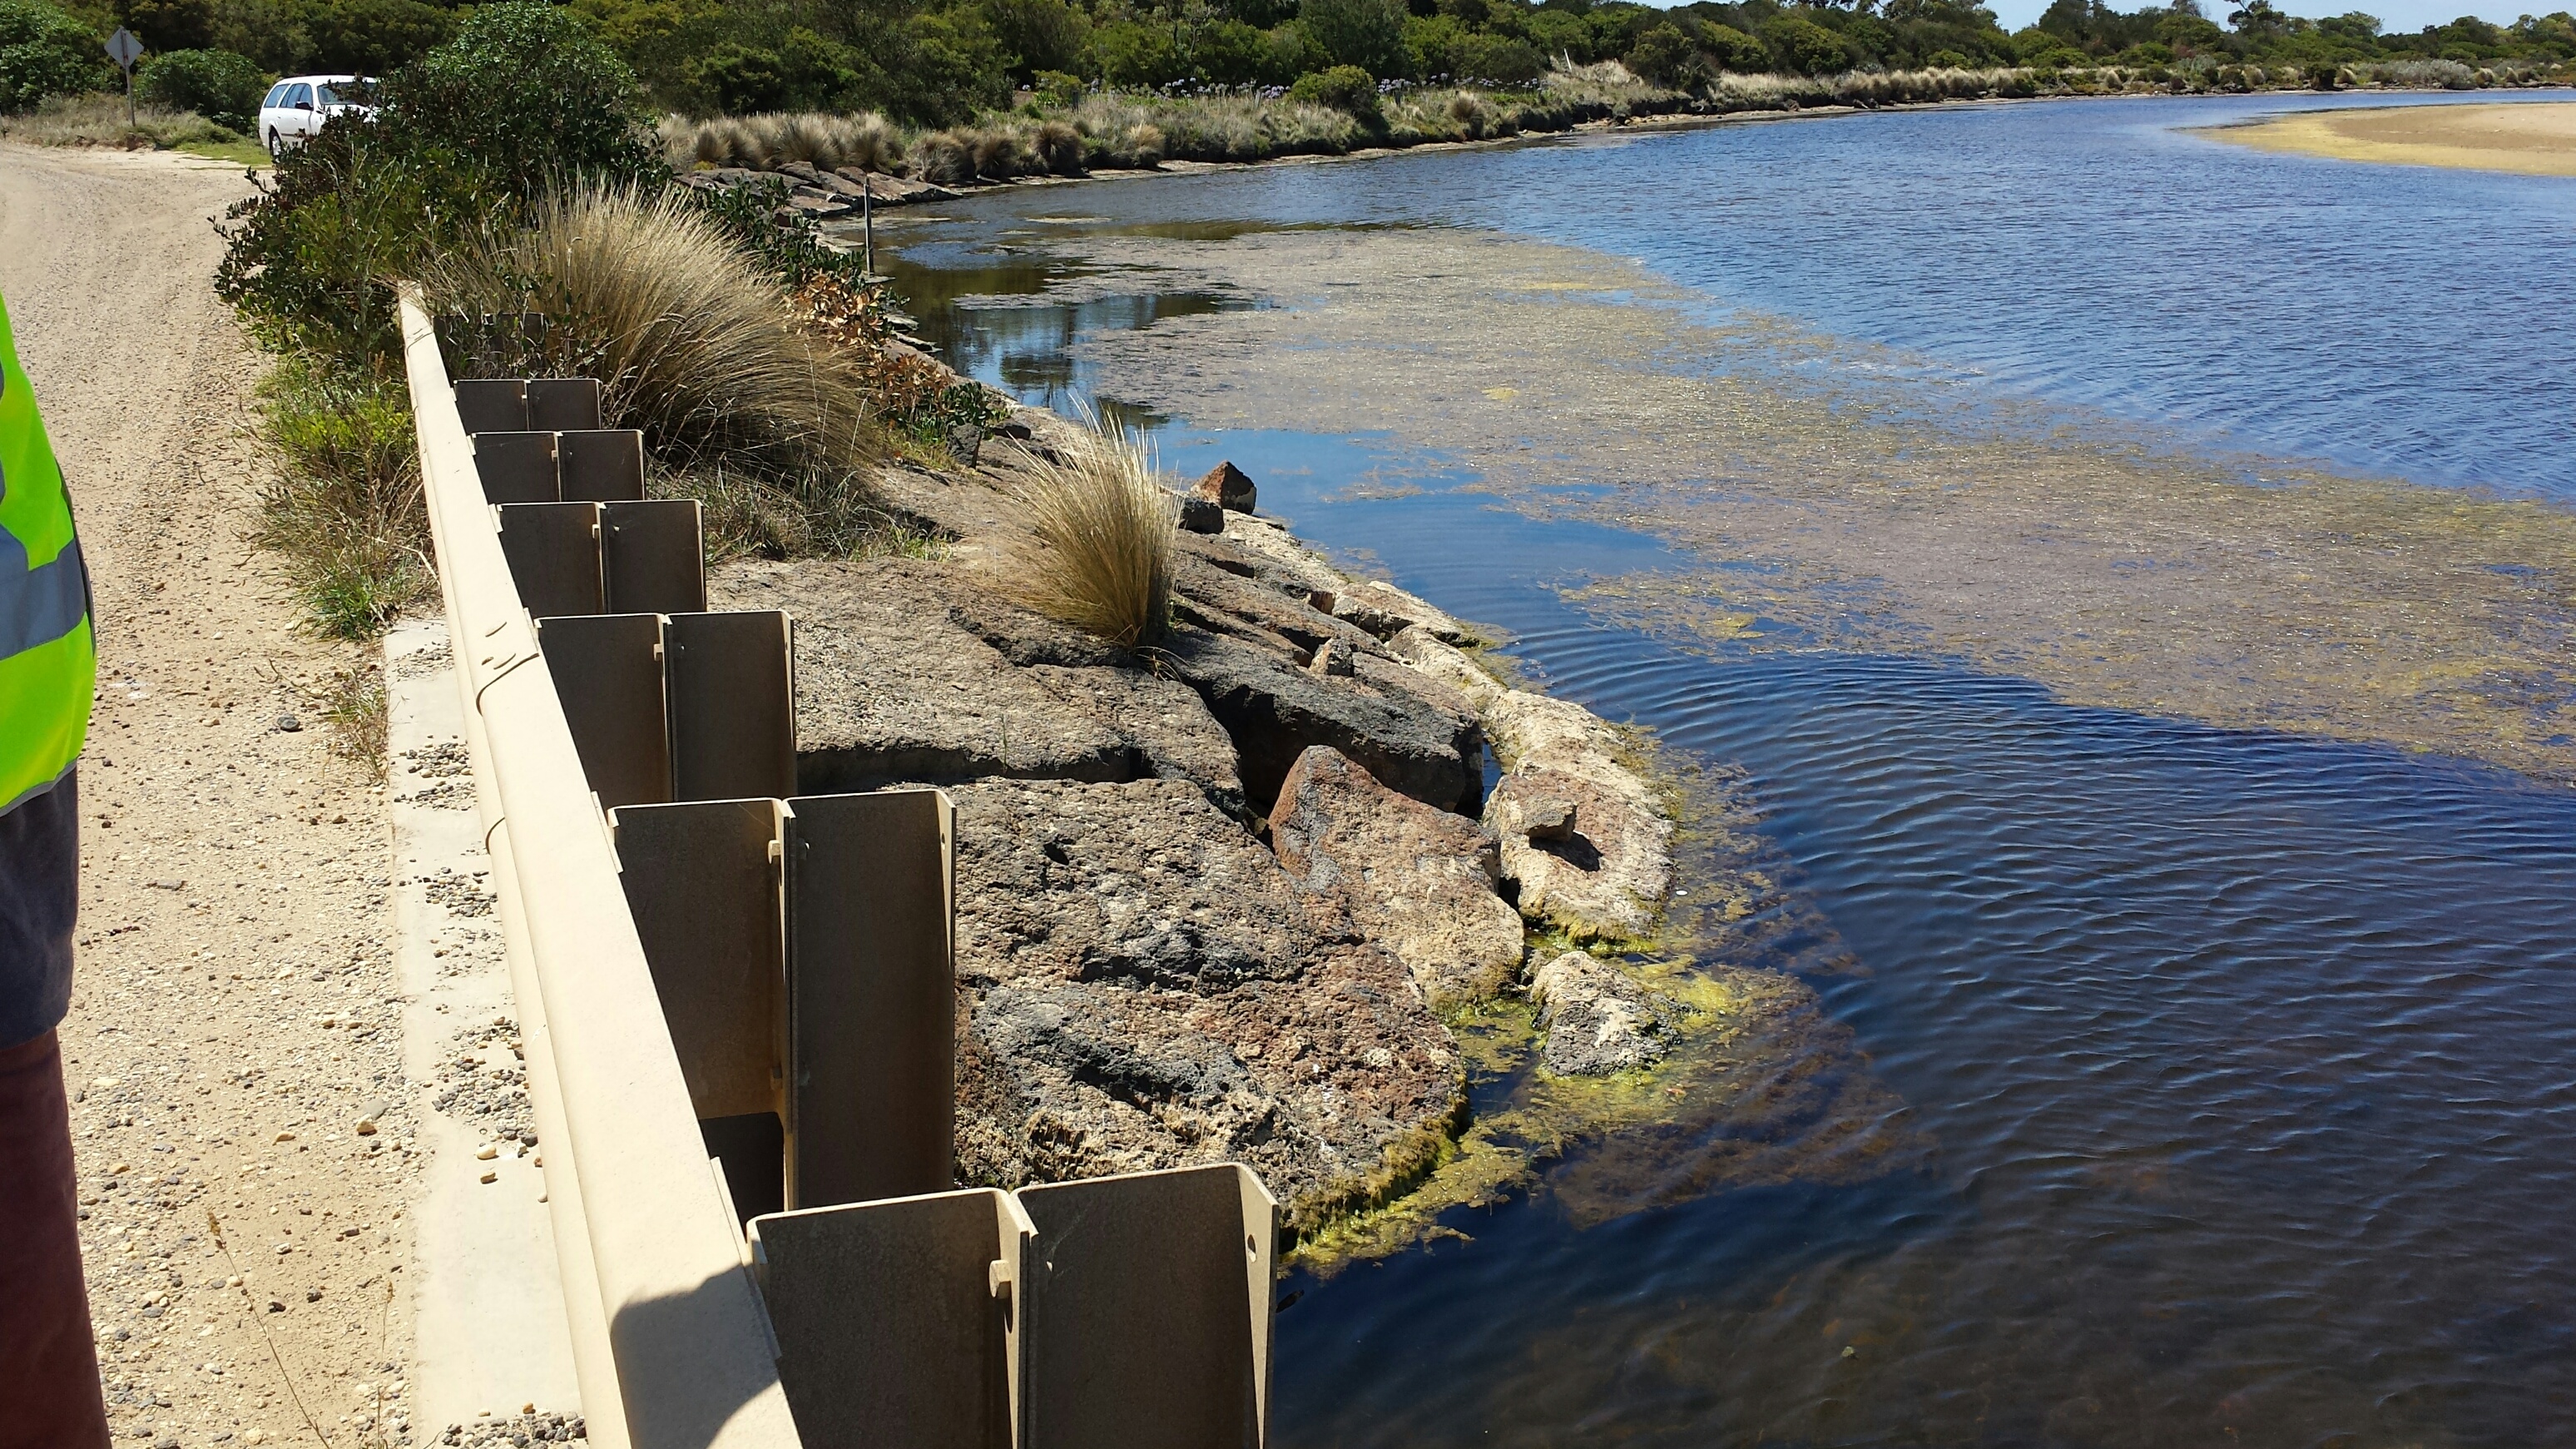
Picture of Monitoring SIte |
|
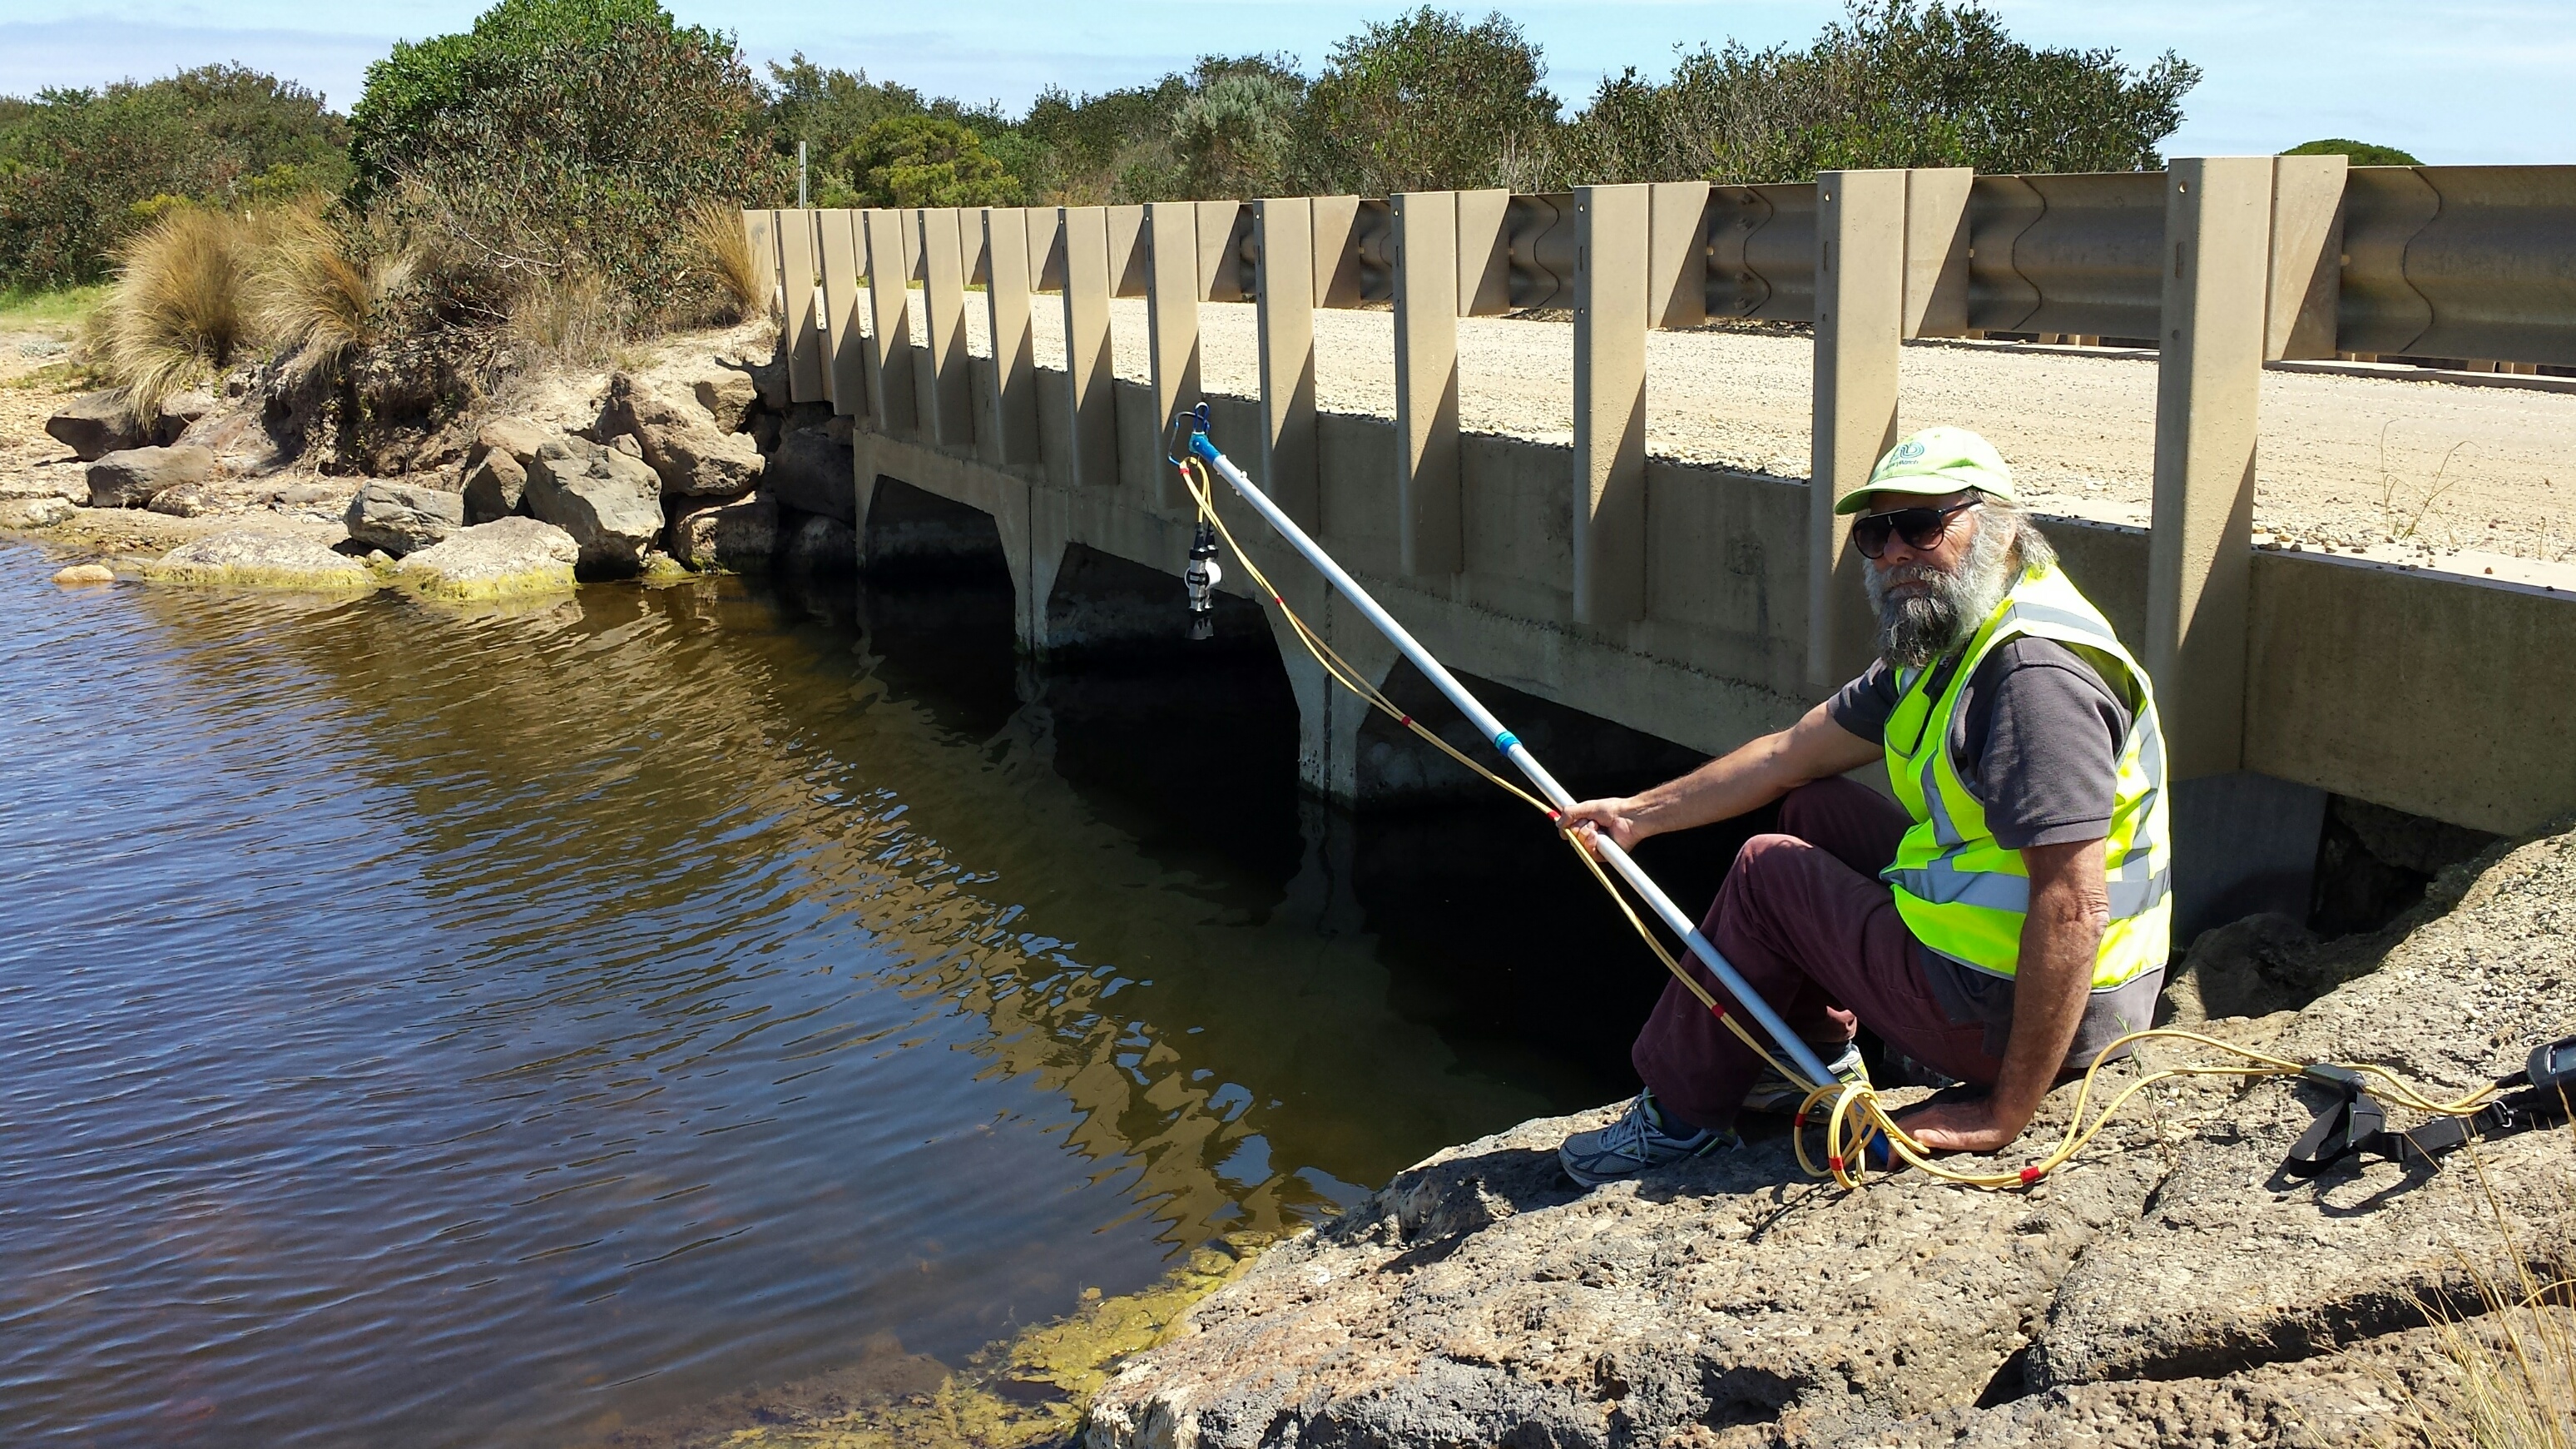
Site T1 Image |
|
Observations
Turbidity tubes do not measure below 9 NTU; Chart values of 9 should be interpreted as < 9 NTU
Observations
Observation summaries
Turbidity NTU
| 18-06-2023 | 16-07-2023 | |
|---|---|---|
| Top | 9.0 | 9.0 |
| Bottom | 9.0 |
pH
| 18-06-2023 | 16-07-2023 | |
|---|---|---|
| Top | 8.3 | |
| Bottom |
Ammonia mg/L
| 18-06-2023 | 16-07-2023 | |
|---|---|---|
| Top | ||
| Bottom |
Enterococci orgs/100mL
| 18-06-2023 | 16-07-2023 | |
|---|---|---|
| Top | ||
| Bottom |
Temperature ° C
| 18-06-2023 | 16-07-2023 | |
|---|---|---|
| Top | 12.90 | 11.50 |
| Bottom | 12.90 | 11.70 |
Salinity ppt
| 18-06-2023 | 16-07-2023 | |
|---|---|---|
| Top | 38.60 | 39.10 |
| Bottom | 38.60 | 39.00 |
D.O. mg/L
| 18-06-2023 | 16-07-2023 | |
|---|---|---|
| Top | 11.39 | 11.94 |
| Bottom | 11.34 | 11.83 |
D.O. % Sat
| 18-06-2023 | 16-07-2023 | |
|---|---|---|
| Top | 108.50 | 108.50 |
| Bottom | 108.30 | 108.10 |
Conductivity mS/cm
| 18-06-2023 | 16-07-2023 | |
|---|---|---|
| Top | 55.10 | 55.80 |
| Bottom | 55.10 | 55.70 |

All content, files, data and images provided by the EstuaryWatch Data Portal and Gallery are subject to a Creative Commons Attribution License
Content is made available to be used in any way, and should always attribute EstuaryWatch and www.estuarywatch.org.au