EstuaryWatch Data Portal
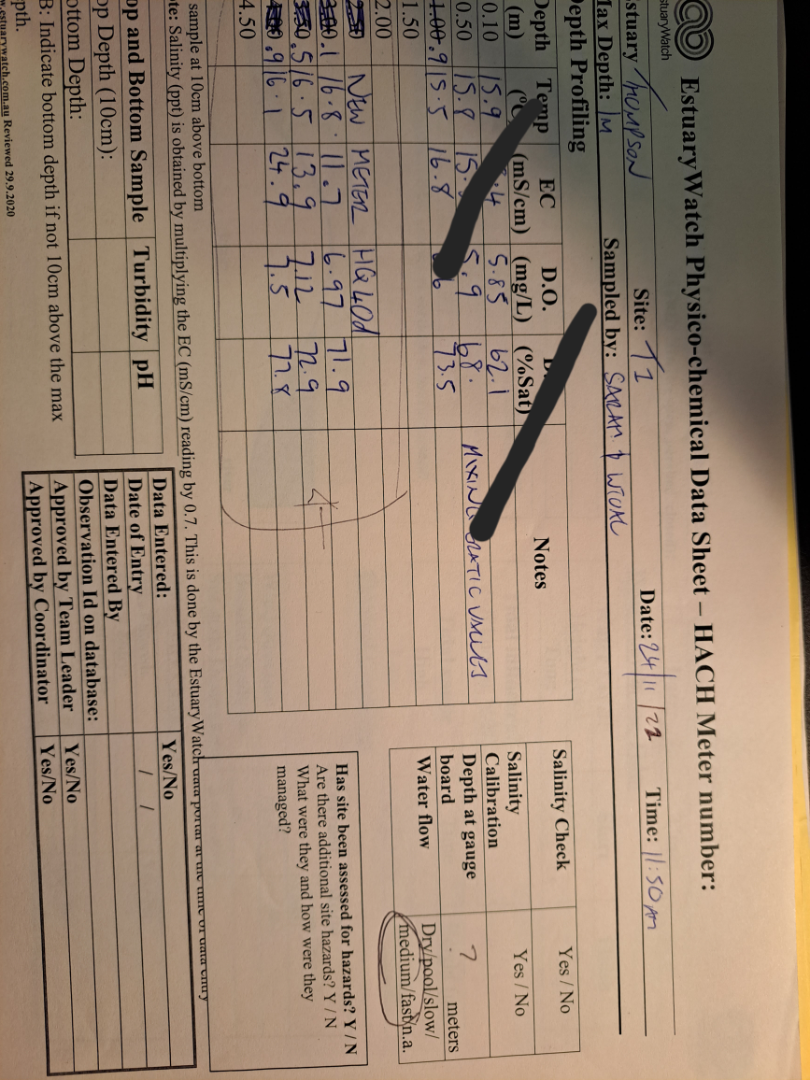
T1 Point Impossible Road Culvert at Mullet Creek
Active Physico-Chemical 17-10-2014 - 16-07-2023Thompson Creek Estuary
| ID | Date | Status | Details | ||||||||||||||||||||||||||
|---|---|---|---|---|---|---|---|---|---|---|---|---|---|---|---|---|---|---|---|---|---|---|---|---|---|---|---|---|---|
| #14842 | 28 Nov 2021 | Pending |
Notes:
Turbidity on bottom sample measured at less than 9 |
||||||||||||||||||||||||||
|
|||||||||||||||||||||||||||||
| #14839 | 20 Feb 2022 | Pending |
Notes:
Turbidity was less than 9 Supported by kayleigh |
||||||||||||||||||||||||||
|
|||||||||||||||||||||||||||||
| #14836 | 20 Mar 2022 | Pending |
Notes:
Notes Turbidity was less than 9 sampling site was full of seaweed making accurate depth profiling difficult. i also believe this may have contributed to the low oxygen readings as this was not consistent with monitoring at the other site. Monitoring supported by Kayleigh |
||||||||||||||||||||||||||
|
|||||||||||||||||||||||||||||
| #14834 | 15 May 2022 | Pending |
Notes:
*notes* did not have turbidity tube to measure did not register AHD gauge changes on mouth sheet, are as follows: AHD 0.93m @ 10:23 AHD 0.97 @ 11:02 |
||||||||||||||||||||||||||
|
|||||||||||||||||||||||||||||
| #15628 | 17 Jul 2022 | Pending |
|
||||||||||||||||||||||||||
|
|||||||||||||||||||||||||||||
| #14829 | 19 Jul 2022 | Approved | |||||||||||||||||||||||||||
|
|||||||||||||||||||||||||||||
| #15631 | 21 Aug 2022 | Pending |
Notes:
No fish - erratic |
||||||||||||||||||||||||||
|
|||||||||||||||||||||||||||||
| #15634 | 20 Nov 2022 | Pending |
Notes:
EC values appeared written down wrong (x.xx) have adjusted these to xx.x which fit much better with the average. |
||||||||||||||||||||||||||
|
|||||||||||||||||||||||||||||
| #15801 | 24 Nov 2022 | Approved |
 |
||||||||||||||||||||||||||
|
|||||||||||||||||||||||||||||
| #15637 | 18 Dec 2022 | Pending |
Notes:
Did not collect bottom sampling as water not deep enough. |
||||||||||||||||||||||||||
|
|||||||||||||||||||||||||||||

All content, files, data and images provided by the EstuaryWatch Data Portal and Gallery are subject to a Creative Commons Attribution License
Content is made available to be used in any way, and should always attribute EstuaryWatch and www.estuarywatch.org.au