EstuaryWatch Data Portal
H4 Site four (Jubilee Park)
Active Physico-Chemical 11-08-2010 - 20-04-2024Hopkins River Estuary
| ID | Date | Status | Details | ||||||||||||||||||||||||||
|---|---|---|---|---|---|---|---|---|---|---|---|---|---|---|---|---|---|---|---|---|---|---|---|---|---|---|---|---|---|
| #16123 | 20 Apr 2024 | Pending |
|
||||||||||||||||||||||||||
|
|||||||||||||||||||||||||||||
| #16057 | 15 Mar 2024 | Approved |
Notes:
Assisted by Harriet Very old pH strips used as sensor on pH meter failed 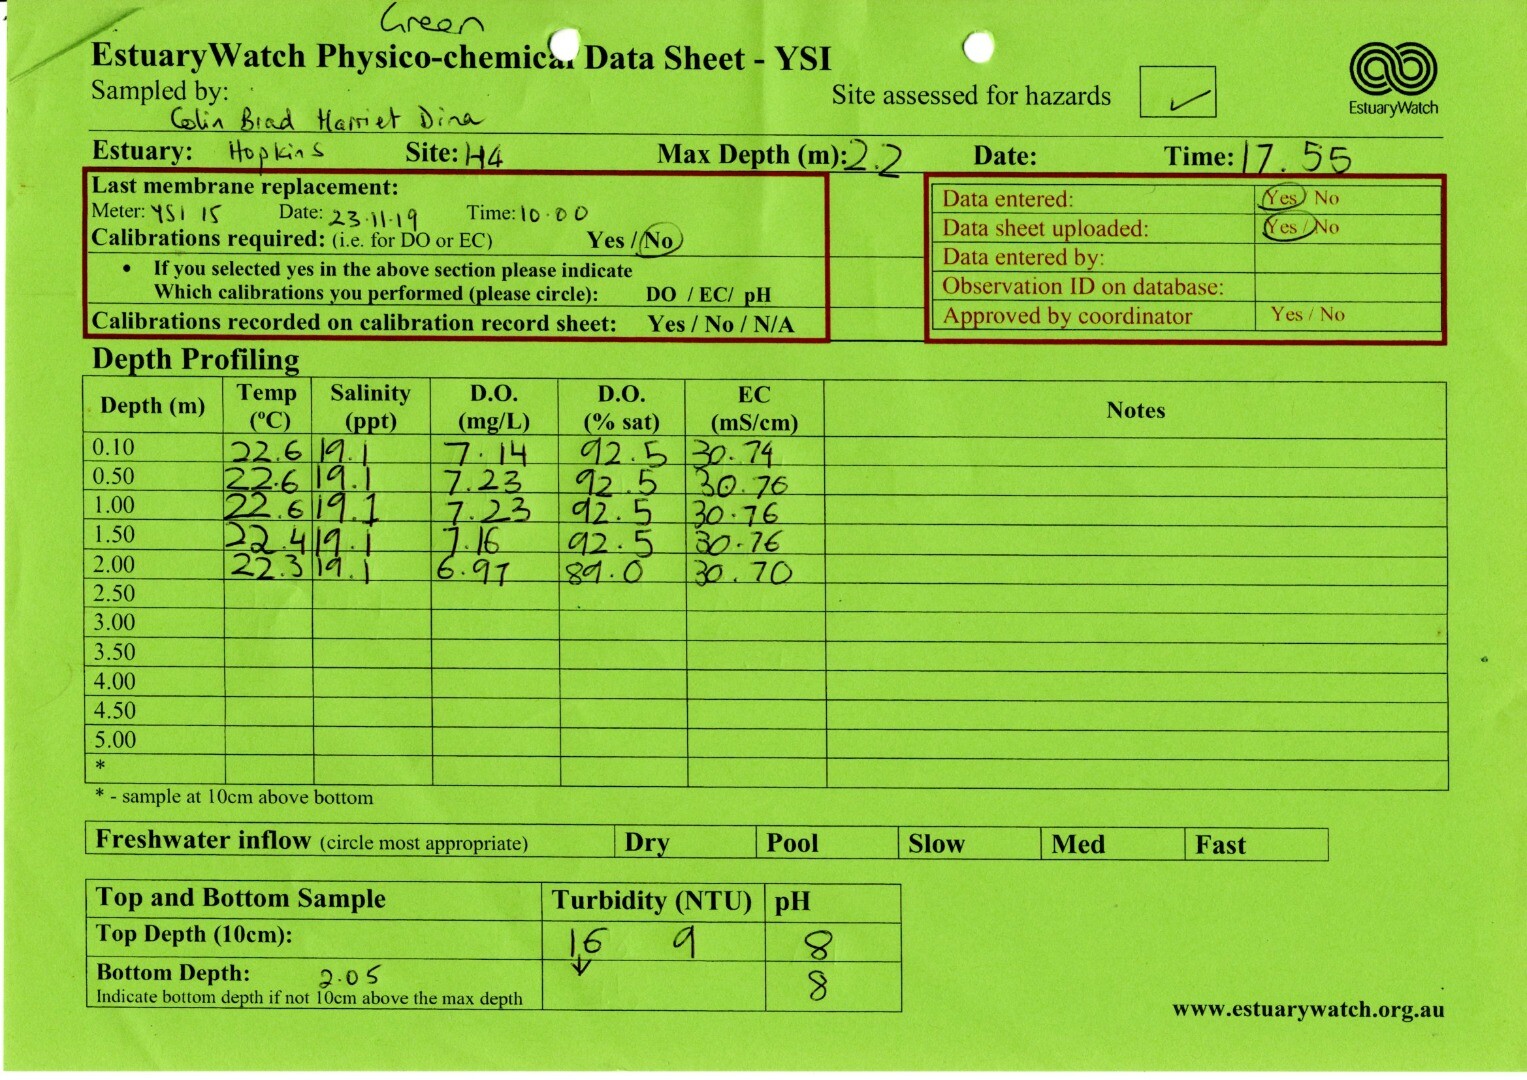 |
||||||||||||||||||||||||||
|
|||||||||||||||||||||||||||||
| #16019 | 16 Feb 2024 | Approved |
Notes:
Assisted by Fiona, and Emily, Harriette and Teddy
Great work everyone. Interesting to see that January's freshwater lens (on the back of heavy Jan rainfall) has dissappeared with extremely dry Feb conditions. 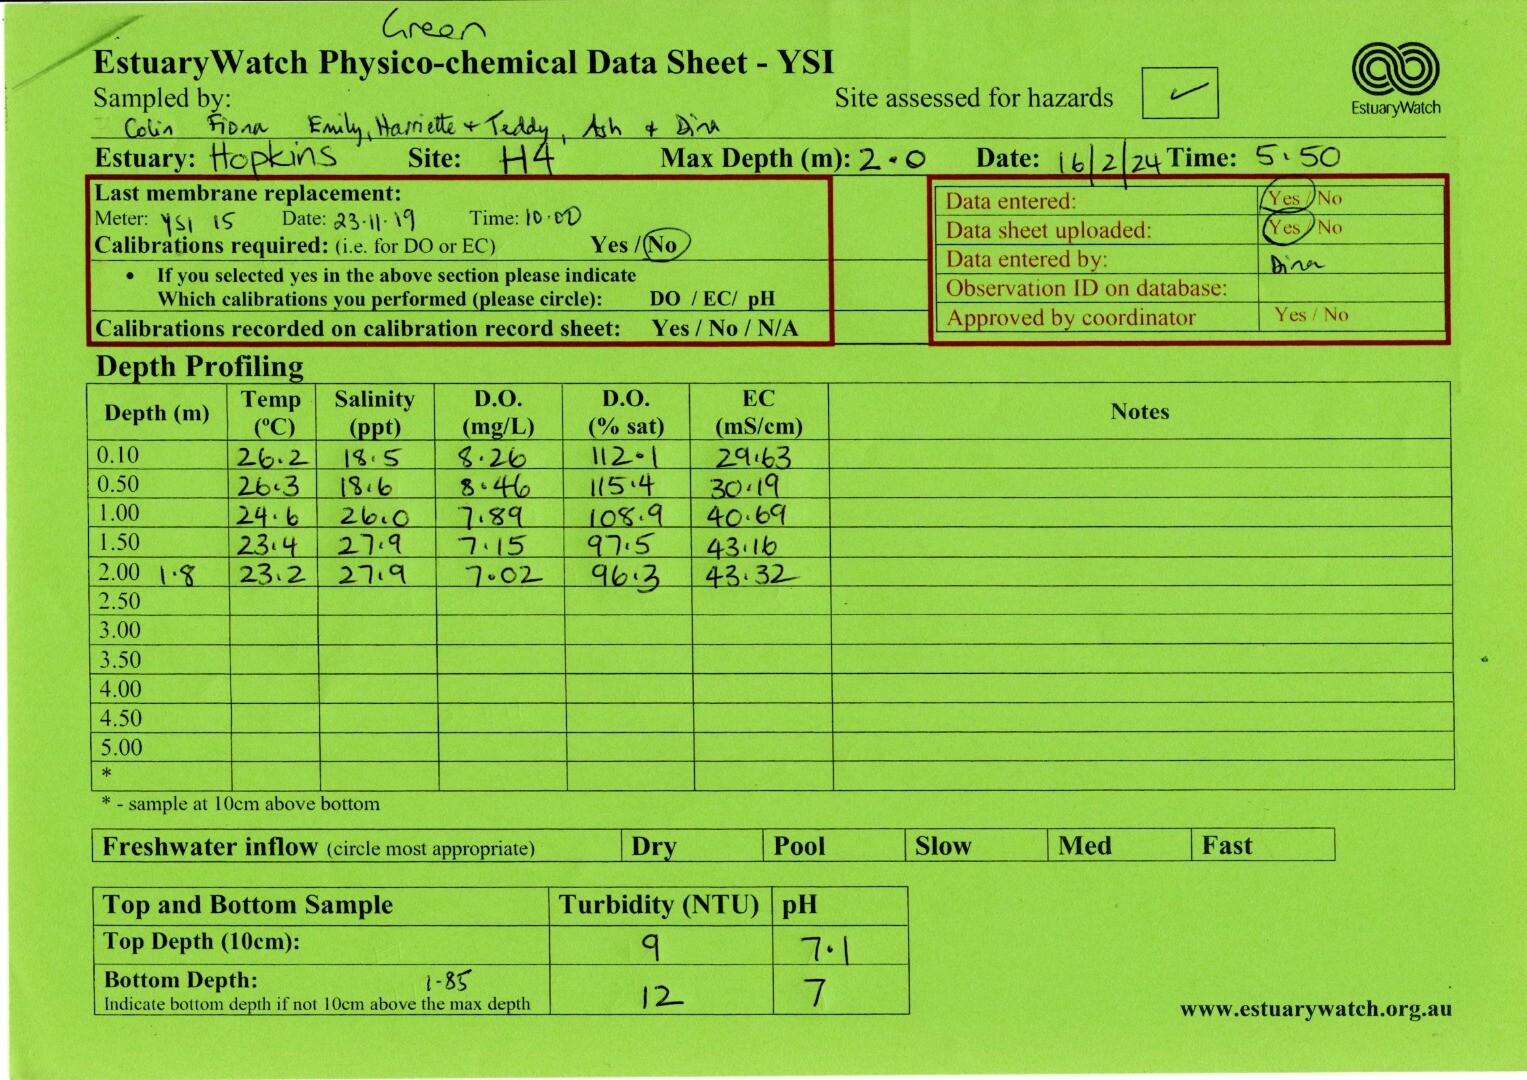 |
||||||||||||||||||||||||||
|
|||||||||||||||||||||||||||||
| #15986 | 19 Jan 2024 | Approved |
Notes:
Great results - with a very distinct freshwater upper lens, and some heavy salt-wedge stratification down low! Thanks Jarred. |
||||||||||||||||||||||||||
|
|||||||||||||||||||||||||||||
| #15920 | 15 Dec 2023 | Approved |
Notes:
Assisted by Fiona |
||||||||||||||||||||||||||
|
|||||||||||||||||||||||||||||
| #15876 | 17 Nov 2023 | Approved |
Notes:
Assisted by Fiona, Emily and Harriette |
||||||||||||||||||||||||||
|
|||||||||||||||||||||||||||||
| #15816 | 20 Oct 2023 | Approved | |||||||||||||||||||||||||||
|
|||||||||||||||||||||||||||||
| #15754 | 16 Sep 2023 | Approved |
Notes:
Assisted by Fiona, Emily and Harriette |
||||||||||||||||||||||||||
|
|||||||||||||||||||||||||||||
| #15715 | 20 Aug 2023 | Approved |
|
||||||||||||||||||||||||||
|
|||||||||||||||||||||||||||||
| #15709 | 14 Jul 2023 | Approved |
|
||||||||||||||||||||||||||
|
|||||||||||||||||||||||||||||
| #15588 | 17 Jun 2023 | Approved |
Notes:
Very windy |
||||||||||||||||||||||||||
|
|||||||||||||||||||||||||||||
| #15546 | 20 May 2023 | Approved | |||||||||||||||||||||||||||
|
|||||||||||||||||||||||||||||
| #15464 | 15 Apr 2023 | Approved |
Notes:
Bottom pH and turbidity values not available as sampler forgotten
Great results again - amazing how far upstream the seawater can penetrate! |
||||||||||||||||||||||||||
|
|||||||||||||||||||||||||||||
| #15355 | 17 Mar 2023 | Approved |
Notes:
Assisted by Sandro Oxygen levels at 0.5 metres double checked and values as noted. JObst - no worreis, quite a plausible DO value, most likely due to a mid-water algal bloom producing excess DO. Thanks for noting this & double checking - great QAQC!! |
||||||||||||||||||||||||||
|
|||||||||||||||||||||||||||||
| #15301 | 17 Feb 2023 | Approved |
Notes:
Assisted by Steve Selman |
||||||||||||||||||||||||||
|
|||||||||||||||||||||||||||||
| #15253 | 20 Jan 2023 | Approved | |||||||||||||||||||||||||||
|
|||||||||||||||||||||||||||||
| #15176 | 14 Dec 2022 | Approved | |||||||||||||||||||||||||||
|
|||||||||||||||||||||||||||||
| #15145 | 18 Nov 2022 | Approved |
Notes:
Great results everyone, thanks for your efforts! Possibly one of the most consistent WQ profiles I've seen through the entire system for some time, hence confirming the flushing/resetting of water quality profile from an extended and high magnitude flood event! It will be very interesting to see what the summer months bring & how long it takes turbidity to settle down. Cheers Jarred. |
||||||||||||||||||||||||||
|
|||||||||||||||||||||||||||||
| #15074 | 14 Oct 2022 | Approved |
Notes:
Instruments moving with flow of water
Great data everyone - incredible turbidity readings!! Also - i can't see a inflow estimate on the data sheet & was wondering if this needs to be updated to 'Fast' given the flood event? Thanks Jarred. |
||||||||||||||||||||||||||
|
|||||||||||||||||||||||||||||
| #15021 | 17 Sep 2022 | Approved |
Notes:
The multi-parameter meter was found turned off just prior to taking obs at this site (last of 4) - I turned back on and continued without re-calibrating. (I started with a full set of calibrations completed)
No worries Brad, thanks for flagging this, but happy to report this shouldn't be an issue. The YSI is a very stable unit and turning on/off between sites isn't an issue - and most importantly results look spot on. Very different profile compared to the lower estuary - very fresh, turbid and well mixed! Great work getting out today, partiuclarly given the weather... Cheers Jarred |
||||||||||||||||||||||||||
|
|||||||||||||||||||||||||||||
| #14965 | 20 Aug 2022 | Approved |
Notes:
Assisted by Grant and Jarred.
Dominated by highly oxygenated and turbid freshwater in true August fashion! - J.Obst. |
||||||||||||||||||||||||||
|
|||||||||||||||||||||||||||||
| #14890 | 16 Jul 2022 | Approved | |||||||||||||||||||||||||||
|
|||||||||||||||||||||||||||||
| #14756 | 18 Jun 2022 | Approved |
Notes:
Assisted by Matisse
Great data set again - with some really interesting low DO's in the bottom stratified level. This is similar to what we found prior to the last artificial opening and i think this represents some 'old' seawater which has been in residence for some time now. This doesn't pose any risk due to a highly oxygenated profile downstream, but a good example of where winter flushing is required to reset the system! Thanks Jarred. |
||||||||||||||||||||||||||
|
|||||||||||||||||||||||||||||
| #14701 | 21 May 2022 | Approved |
Notes:
Hi everyone, great testing once again, sincere thanks. We've had a pretty wild couple of months on the swell front and the data shows a distinct salt-wedge as a result! Interesting times with the mouth too, varying from an open to closed state with the ocean, but looks like it may now stay open into our winter flow season. Thanks |
||||||||||||||||||||||||||
|
|||||||||||||||||||||||||||||
| #14670 | 23 Apr 2022 | Approved |
|
||||||||||||||||||||||||||
|
|||||||||||||||||||||||||||||

All content, files, data and images provided by the EstuaryWatch Data Portal and Gallery are subject to a Creative Commons Attribution License
Content is made available to be used in any way, and should always attribute EstuaryWatch and www.estuarywatch.org.au