EstuaryWatch Data Portal
H4 Site four (Jubilee Park)
Site details
Overview
| Estuary | Hopkins River Estuary |
|---|---|
| CMA | Glenelg Hopkins CMA |
| Type | Physico-Chemical |
| Site code | H4 |
| Site name | Site four (Jubilee Park) |
| Nearest road and town | Jubilee Park Road, Allansford. |
| Description | End of the floating pontoon located closest to the ocean, opposite the Hopkins River Caravan Park/ Jubilee Park. |
| Site access | Head south towards the river along Jubilee Park Road. |
| Land use |
|
| Land use description | Adjacent to farmland, open space reserve and the Hopkins River Caravan Park. |
| Status | Active |
| Observation history | 11-08-2010 - 21-07-2024 |
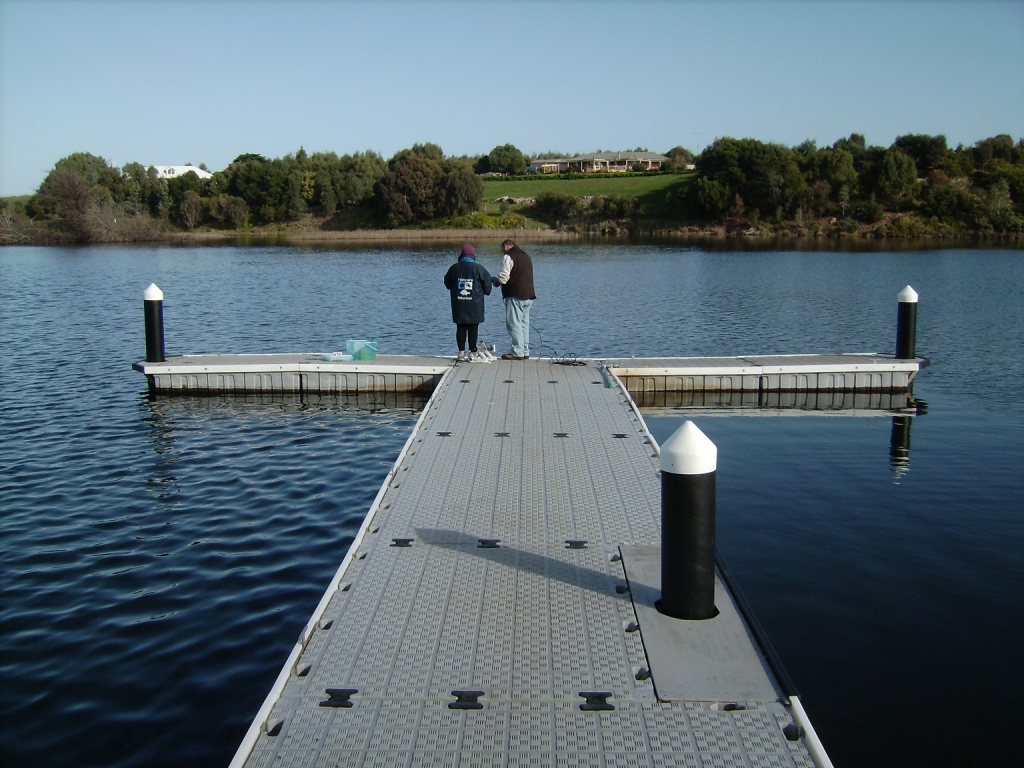
Photo of volunteers at site four. |
|
Observations
Turbidity tubes do not measure below 9 NTU; Chart values of 9 should be interpreted as < 9 NTU
Observations
| Date | 20-08-2023 | 16-09-2023 | 20-10-2023 | 17-11-2023 | 15-12-2023 | 19-01-2024 | 16-02-2024 | 15-03-2024 | 20-04-2024 | 25-05-2024 | 22-06-2024 | 21-07-2024 |
|---|---|---|---|---|---|---|---|---|---|---|---|---|
| Observation | #15715 | #15754 | #15816 | #15876 | #15920 | #15986 | #16019 | #16057 | #16123 | #16185 | #16225 | #16333 |
Observation summaries
Turbidity NTU
| 20-08-2023 | 16-09-2023 | 20-10-2023 | 17-11-2023 | 15-12-2023 | 19-01-2024 | 16-02-2024 | 15-03-2024 | 20-04-2024 | 25-05-2024 | 22-06-2024 | 21-07-2024 | |
|---|---|---|---|---|---|---|---|---|---|---|---|---|
| Top | 21.0 | 15.0 | 9.0 | 10.0 | 11.5 | 9.0 | 9.0 | 9.0 | 9.0 | 10.0 | 9.0 | 9.0 |
| Bottom | 9.0 | 18.0 | 10.0 | 12.0 | 14.2 | 9.0 | 12.0 | 16.0 | 9.0 | 9.0 | 9.0 | 9.0 |
pH
| 20-08-2023 | 16-09-2023 | 20-10-2023 | 17-11-2023 | 15-12-2023 | 19-01-2024 | 16-02-2024 | 15-03-2024 | 20-04-2024 | 25-05-2024 | 22-06-2024 | 21-07-2024 | |
|---|---|---|---|---|---|---|---|---|---|---|---|---|
| Top | 8.4 | 8.6 | 8.1 | 8.7 | 8.3 | 8.4 | 7.1 | 8.0 | 7.0 | 8.2 | 8.3 | 8.3 |
| Bottom | 8.4 | 8.6 | 8.0 | 8.3 | 8.3 | 8.1 | 7.0 | 8.0 | 7.0 | 7.9 | 8.1 | 8.1 |
Ammonia mg/L
| 20-08-2023 | 16-09-2023 | 20-10-2023 | 17-11-2023 | 15-12-2023 | 19-01-2024 | 16-02-2024 | 15-03-2024 | 20-04-2024 | 25-05-2024 | 22-06-2024 | 21-07-2024 | |
|---|---|---|---|---|---|---|---|---|---|---|---|---|
| Top | ||||||||||||
| Bottom |
Enterococci orgs/100mL
| 20-08-2023 | 16-09-2023 | 20-10-2023 | 17-11-2023 | 15-12-2023 | 19-01-2024 | 16-02-2024 | 15-03-2024 | 20-04-2024 | 25-05-2024 | 22-06-2024 | 21-07-2024 | |
|---|---|---|---|---|---|---|---|---|---|---|---|---|
| Top | ||||||||||||
| Bottom |
Temperature ° C
| 20-08-2023 | 16-09-2023 | 20-10-2023 | 17-11-2023 | 15-12-2023 | 19-01-2024 | 16-02-2024 | 15-03-2024 | 20-04-2024 | 25-05-2024 | 22-06-2024 | 21-07-2024 | |
|---|---|---|---|---|---|---|---|---|---|---|---|---|
| Top | 12.90 | 15.50 | 22.40 | 20.70 | 22.70 | 22.80 | 26.20 | 22.60 | 17.30 | 12.70 | 12.00 | 11.00 |
| Bottom | 13.40 | 15.10 | 17.70 | 18.90 | 22.50 | 20.80 | 23.40 | 22.30 | 19.30 | 16.20 | 15.20 | 13.50 |
Salinity ppt
| 20-08-2023 | 16-09-2023 | 20-10-2023 | 17-11-2023 | 15-12-2023 | 19-01-2024 | 16-02-2024 | 15-03-2024 | 20-04-2024 | 25-05-2024 | 22-06-2024 | 21-07-2024 | |
|---|---|---|---|---|---|---|---|---|---|---|---|---|
| Top | 1.80 | 2.10 | 2.50 | 4.40 | 6.70 | 2.50 | 18.50 | 19.10 | 8.40 | 3.20 | 2.40 | 3.20 |
| Bottom | 29.40 | 2.30 | 29.90 | 29.50 | 17.60 | 28.20 | 27.90 | 19.10 | 17.50 | 12.10 | 15.20 | 16.80 |
D.O. mg/L
| 20-08-2023 | 16-09-2023 | 20-10-2023 | 17-11-2023 | 15-12-2023 | 19-01-2024 | 16-02-2024 | 15-03-2024 | 20-04-2024 | 25-05-2024 | 22-06-2024 | 21-07-2024 | |
|---|---|---|---|---|---|---|---|---|---|---|---|---|
| Top | 11.30 | 11.40 | 9.86 | 10.70 | 10.20 | 9.55 | 8.26 | 7.14 | 8.69 | 10.23 | 10.40 | 11.28 |
| Bottom | 3.40 | 11.70 | 10.48 | 6.10 | 7.76 | 6.44 | 7.02 | 6.97 | 4.44 | 3.95 | 1.75 | 4.30 |
D.O. % Sat
| 20-08-2023 | 16-09-2023 | 20-10-2023 | 17-11-2023 | 15-12-2023 | 19-01-2024 | 16-02-2024 | 15-03-2024 | 20-04-2024 | 25-05-2024 | 22-06-2024 | 21-07-2024 | |
|---|---|---|---|---|---|---|---|---|---|---|---|---|
| Top | 107.20 | 116.50 | 115.90 | 122.20 | 123.90 | 112.60 | 112.10 | 92.50 | 93.50 | 95.40 | 96.70 | 104.00 |
| Bottom | 37.40 | 118.20 | 131.90 | 76.70 | 99.20 | 83.20 | 96.30 | 89.00 | 50.90 | 40.70 | 18.80 | 43.20 |
Conductivity mS/cm
| 20-08-2023 | 16-09-2023 | 20-10-2023 | 17-11-2023 | 15-12-2023 | 19-01-2024 | 16-02-2024 | 15-03-2024 | 20-04-2024 | 25-05-2024 | 22-06-2024 | 21-07-2024 | |
|---|---|---|---|---|---|---|---|---|---|---|---|---|
| Top | 3.49 | 4.00 | 4.67 | 7.90 | 11.81 | 4.63 | 29.63 | 30.74 | 14.31 | 5.92 | 4.52 | 5.89 |
| Bottom | 45.53 | 4.30 | 46.10 | 45.80 | 28.64 | 43.69 | 43.32 | 30.70 | 28.42 | 20.63 | 24.88 | 27.07 |

All content, files, data and images provided by the EstuaryWatch Data Portal and Gallery are subject to a Creative Commons Attribution License
Content is made available to be used in any way, and should always attribute EstuaryWatch and www.estuarywatch.org.au