EstuaryWatch Data Portal
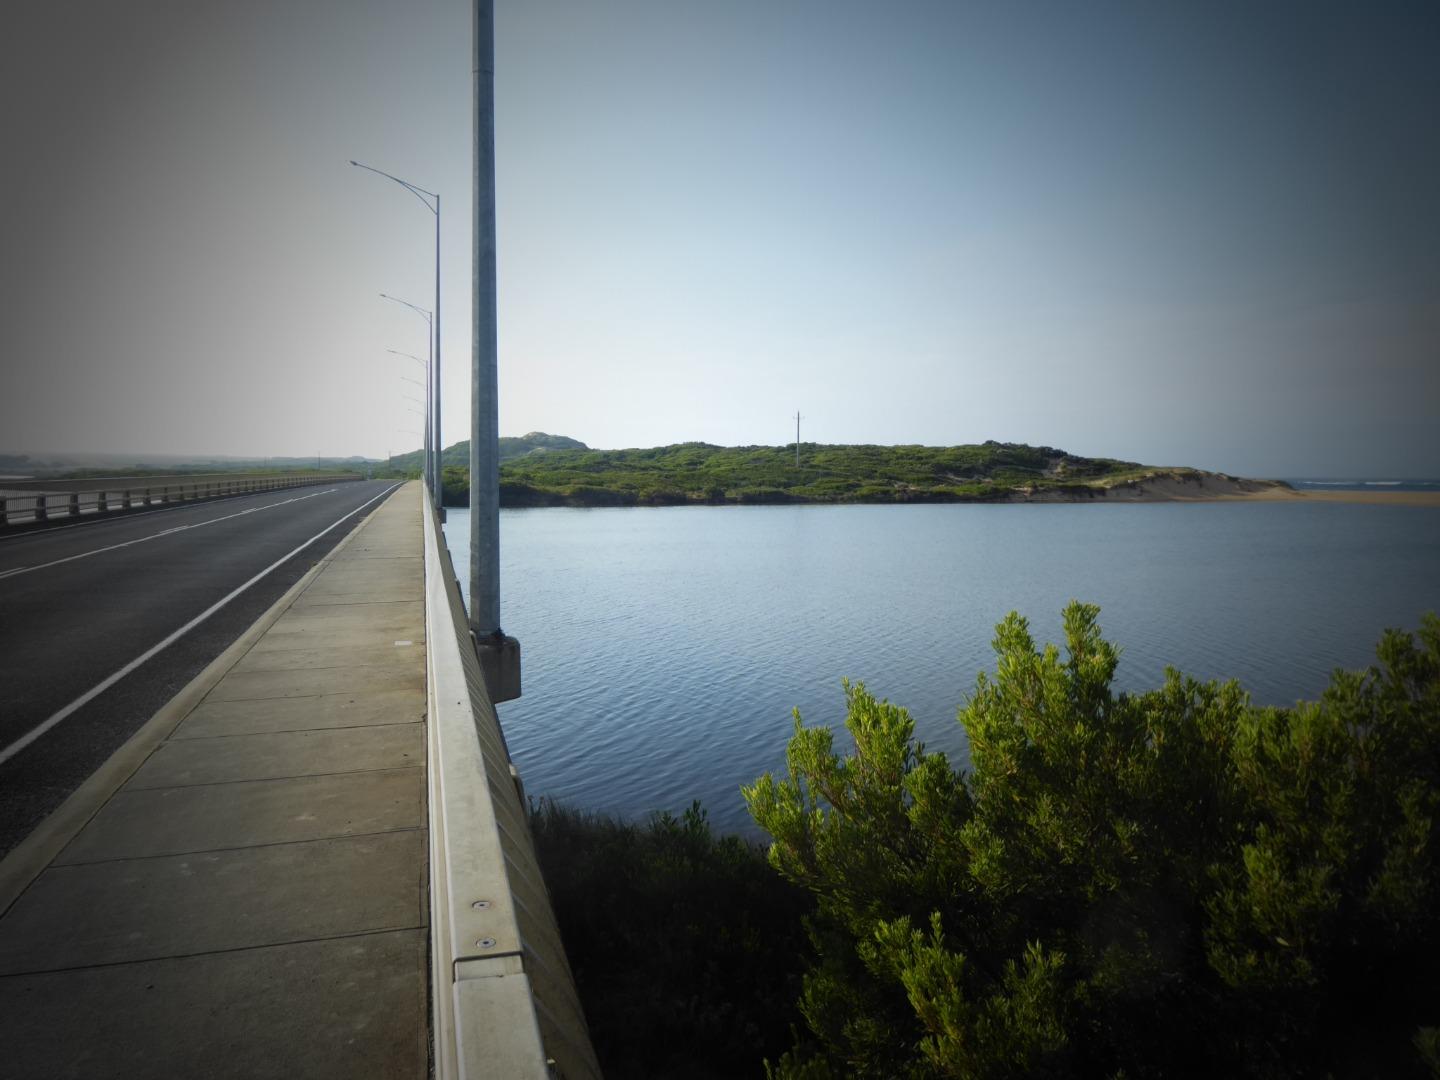
Cu2 Boggy Creek Road fishing jetty
Active Physico-Chemical 11-12-2013 - 02-04-2024Curdies River Estuary
| ID | Date | Status | Details | ||||||||||||||||||||||||||
|---|---|---|---|---|---|---|---|---|---|---|---|---|---|---|---|---|---|---|---|---|---|---|---|---|---|---|---|---|---|
| #16085 | 2 Apr 2024 | Pending |
Notes:
Phosphate = 0.75 Nitrates = 0.0 Nitrates = 0.0
Nitrites = 0.0
|
||||||||||||||||||||||||||
|
|||||||||||||||||||||||||||||
| #16042 | 5 Mar 2024 | Pending |
Notes:
Phosphate = 0.15 Nitrate = 10 Nitrite -= 1
There were few signs of Blue-Green Algae in the upper stretches of the river |
||||||||||||||||||||||||||
|
|||||||||||||||||||||||||||||
| #15999 | 6 Feb 2024 | Pending |
Notes:
Phosphate = 0.10 Nitrate = 2 Nitrate = 1 |
||||||||||||||||||||||||||
|
|||||||||||||||||||||||||||||
| #15944 | 2 Jan 2024 | Approved |
Notes:
Using HACH HQ 2200 meter, but DO probe misbehaving.
TOP. NO2 reading = 0.0. NO3 Reading 0.0. Phosphate reading = 0.07 BOTTOM. NO@ reading = 0.0 NO3 reading = 0.0. Phosphate reading = 0.02 |
||||||||||||||||||||||||||
|
|||||||||||||||||||||||||||||
| #15895 | 5 Dec 2023 | Approved |
Notes:
Nitrite = 0.0 Nitrate = 0.0 Phosphate could not be tested because one of the test tubes broke. |
||||||||||||||||||||||||||
|
|||||||||||||||||||||||||||||
| #15831 | 7 Nov 2023 | Approved |
Notes:
No readings of temperature, Salinity, Diss0lved Oxygen or Electrical conductivity were possible because our multi-parameter meter has not been returned after repair. Readings were made of: - Nitrates = 0.0 Nitrites = 0.0 Phosphates = 0.02
|
||||||||||||||||||||||||||
|
|||||||||||||||||||||||||||||
| #15787 | 3 Oct 2023 | Approved |
Notes:
We were unable to measure Temperature, Dissolved Oxygen and Electrical Conductivity because our multi-purpose meter was under repair.
Phosphate reading - Top = 0.07 Bottom = 0.07 Nitrate reading Top = 10 Bottom = 1 Nitrite reading Top = 0.07 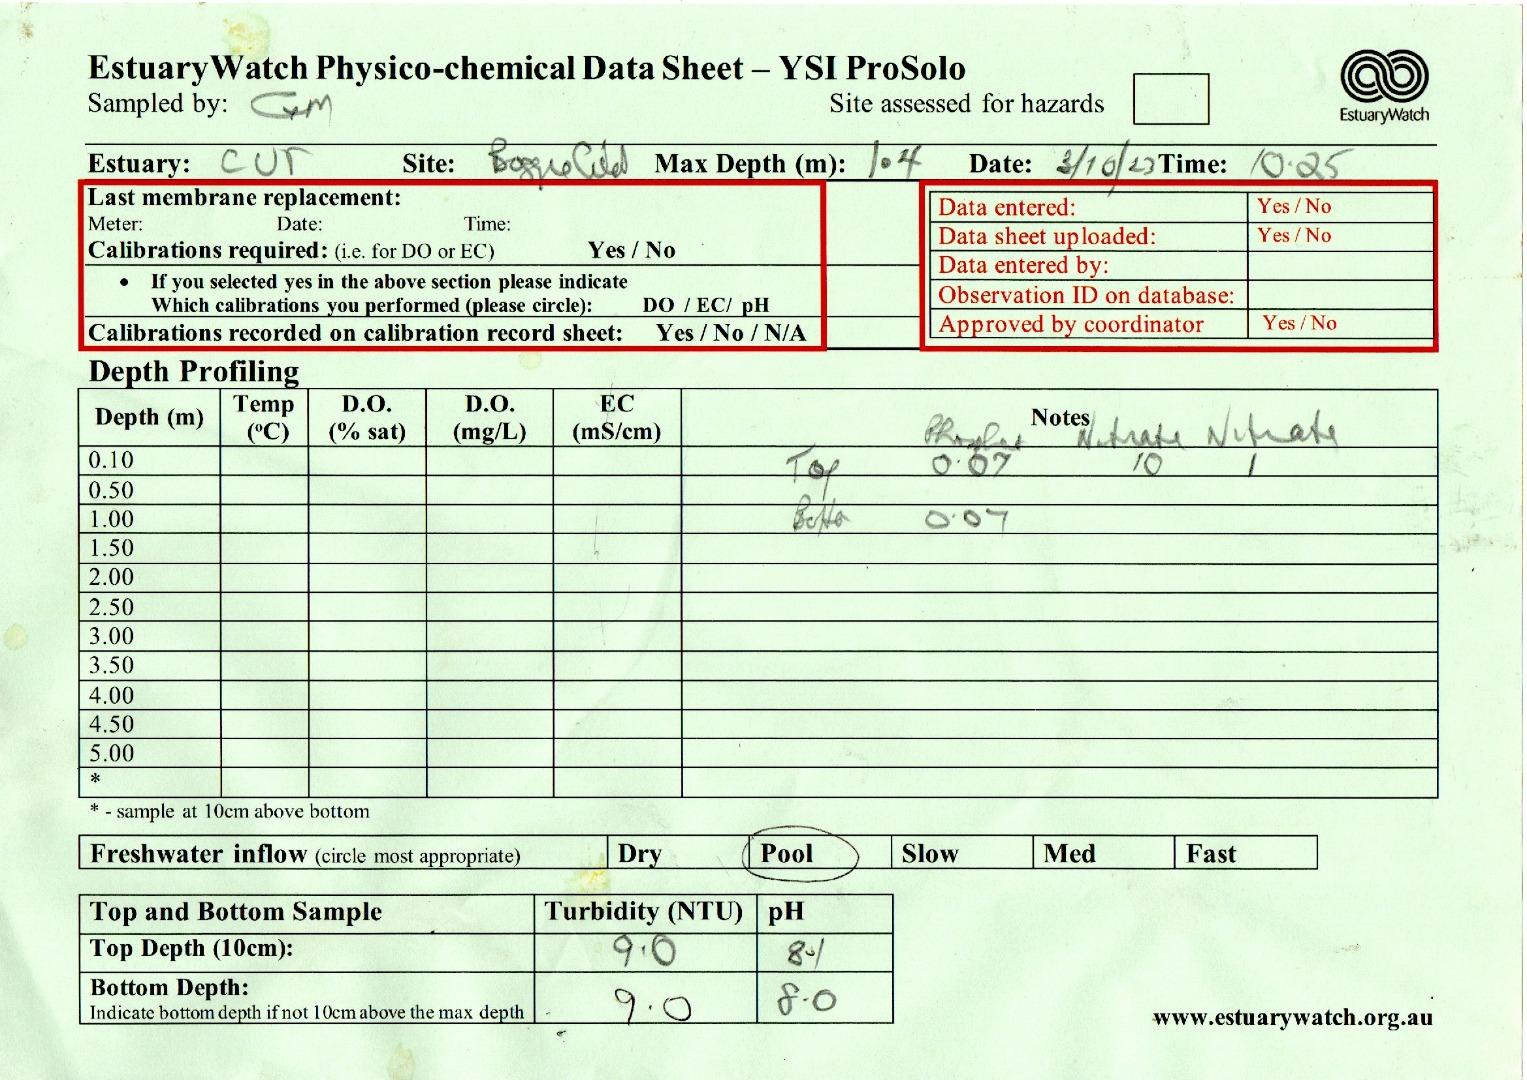 |
||||||||||||||||||||||||||
|
|||||||||||||||||||||||||||||
| #15737 | 5 Sep 2023 | Approved |
Notes:
Phosphate = 0.15 Nitrite = 1 Nitrate = 10 |
||||||||||||||||||||||||||
|
|||||||||||||||||||||||||||||
| #15680 | 31 Jul 2023 | Approved |
Notes:
Nitrate = 10 Nitrite = 0 Phosphate = .05 |
||||||||||||||||||||||||||
|
|||||||||||||||||||||||||||||
| #15617 | 4 Jul 2023 | Approved |
Notes:
Phosphate Test = 0.25 Nitrate Test = 10 Nitrite Test = o |
||||||||||||||||||||||||||
|
|||||||||||||||||||||||||||||
| #15568 | 6 Jun 2023 | Approved |
Notes:
The surface of the monitoring site was very slippery, and great care was necessary to avoid slipping.
Nitrate < 10. Nitrate < 1. Phosphorus > 0.25 |
||||||||||||||||||||||||||
|
|||||||||||||||||||||||||||||
| #15502 | 2 May 2023 | Approved |
Notes:
No sampling was possible because our sampling position was flooded. We were able to undertake Phosphate, Nitrate and Nitrite tests, taking samples from a bridge near our sampling position. Results were: - Phosphate 0.015 mg/l Nitrate. 0 - 10 Nitrite 0 - 1 Each time I tried to load photos or scans, the program wouj=ld shut down, so I havd sent the photos and scans to Deirdre Murphy in an email.  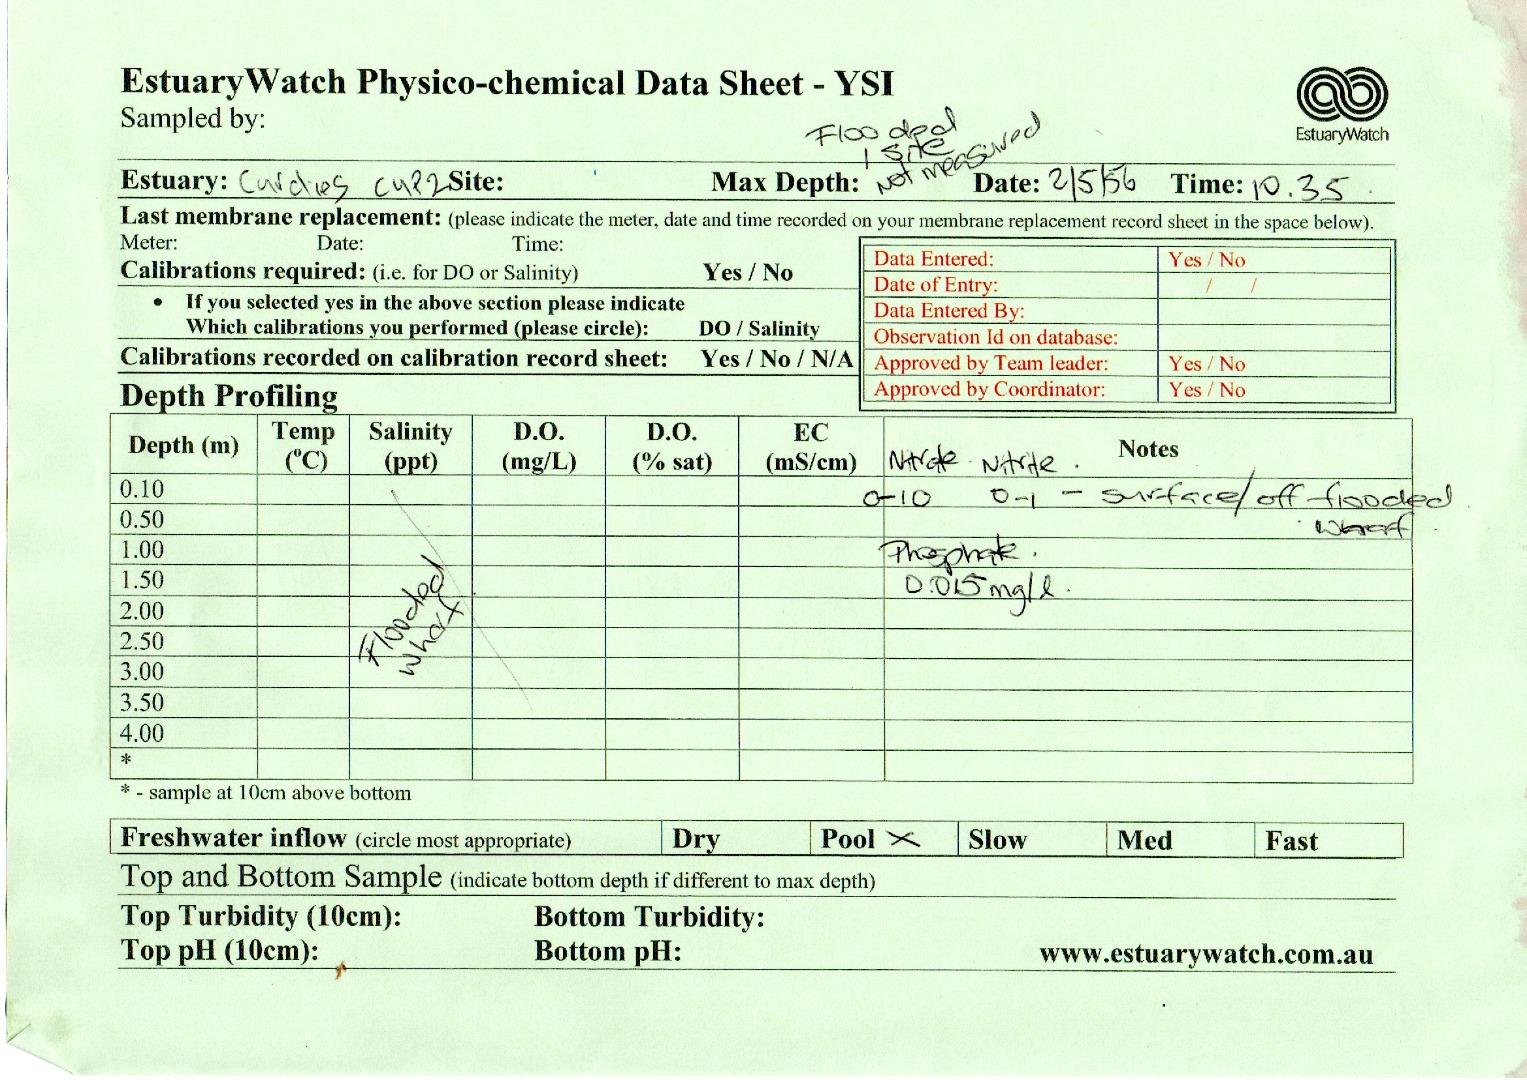 |
||||||||||||||||||||||||||
|
|||||||||||||||||||||||||||||
| #15386 | 4 Apr 2023 | Approved | |||||||||||||||||||||||||||
|
|||||||||||||||||||||||||||||
| #15334 | 7 Mar 2023 | Approved |
|
||||||||||||||||||||||||||
|
|||||||||||||||||||||||||||||
| #15269 | 7 Feb 2023 | Approved |
Notes:
All photos were uploaded to the Mouth Condition Data Sheet |
||||||||||||||||||||||||||
|
|||||||||||||||||||||||||||||
| #15207 | 3 Jan 2023 | Approved |
Notes:
We ran out of Data Sheets, so we filled out the Data for Boggie Creek at the bottom of the Dorey Street sheet. I have copied out the data for Boggie Creek onto a separate sheet for clarity, (I hope) We need new green sheets before the next monitoring day. Adam Nash monitored with me at Boggie Creek (Marg O'Toole had other duties to perform.) I could not include Adam on the Internet data. 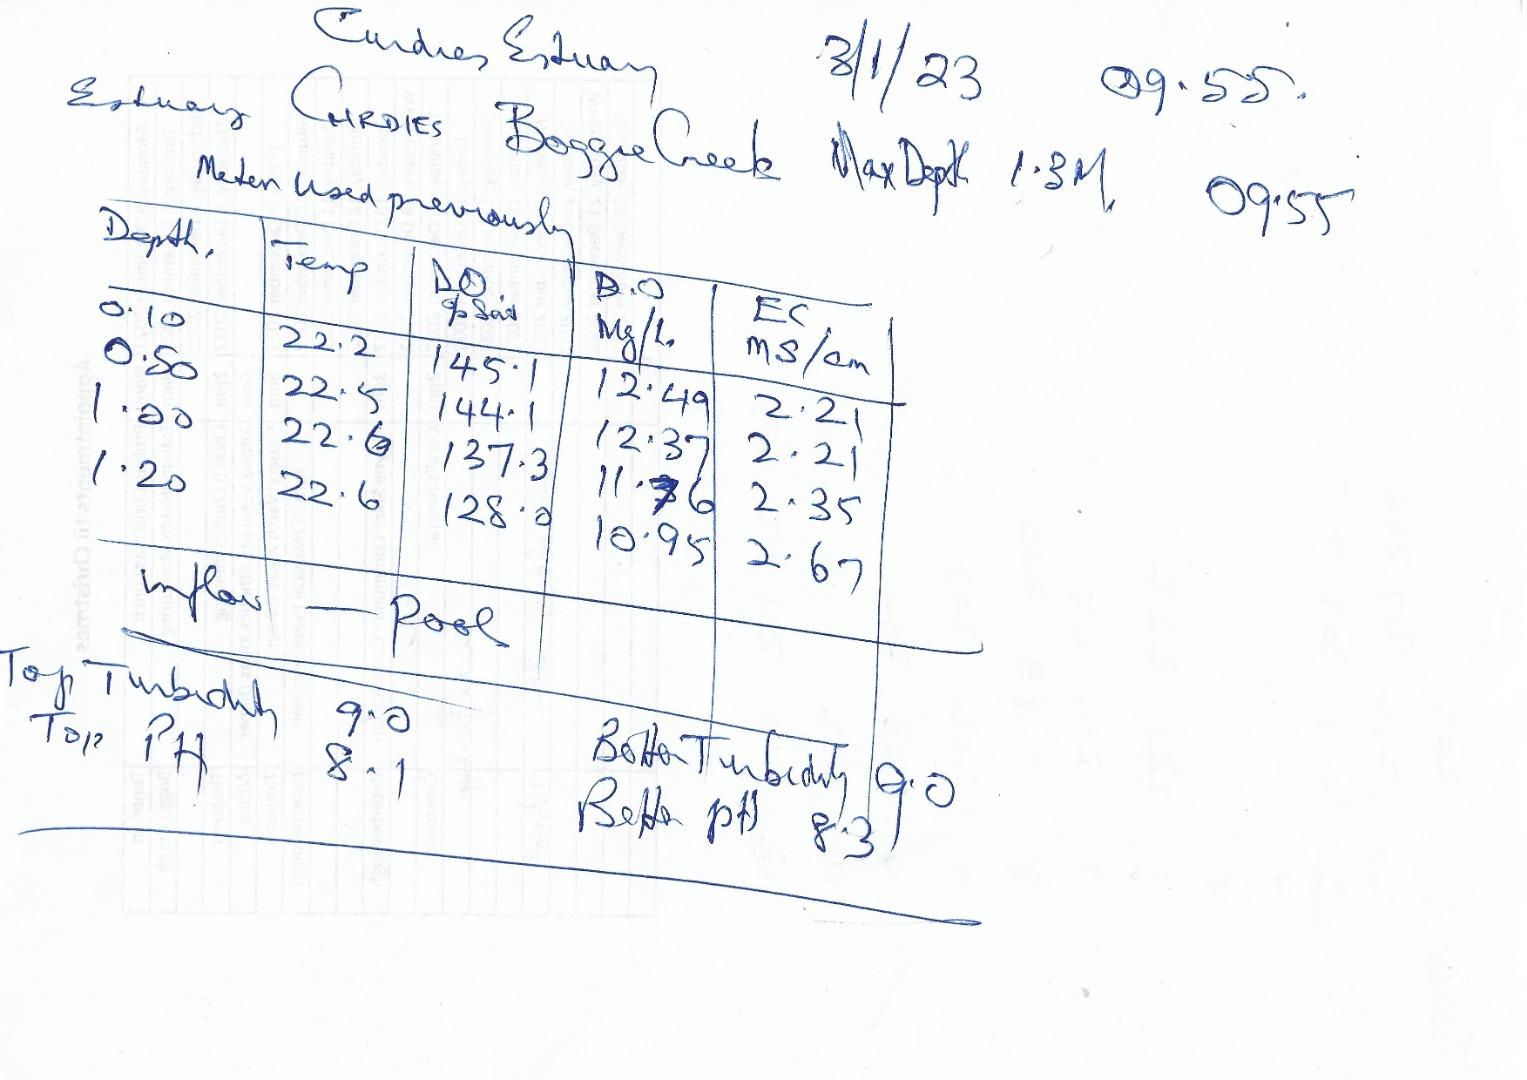 |
||||||||||||||||||||||||||
|
|||||||||||||||||||||||||||||
| #15158 | 6 Dec 2022 | Approved |
Notes:
Datasheet not attached. |
||||||||||||||||||||||||||
|
|||||||||||||||||||||||||||||
| #15108 | 4 Nov 2022 | Approved |
Notes:
The pH meter could not be calibrated correctly, thud samples from top and bottom were not tested for pH. |
||||||||||||||||||||||||||
|
|||||||||||||||||||||||||||||
| #15054 | 4 Oct 2022 | Approved |
|
||||||||||||||||||||||||||
|
|||||||||||||||||||||||||||||
| #14992 | 6 Sep 2022 | Approved |
Notes:
: -The pH meter failed the calibration test. We took readings with it, results were:- TOP 7.2 BOTTOM 7.3
Adam Nash was a sampler, but we could not include him as his name is not in the program. |
||||||||||||||||||||||||||
|
|||||||||||||||||||||||||||||
| #14921 | 2 Aug 2022 | Approved |
|
||||||||||||||||||||||||||
|
|||||||||||||||||||||||||||||
| #14721 | 7 Jun 2022 | Approved |
|
||||||||||||||||||||||||||
|
|||||||||||||||||||||||||||||
| #14645 | 3 May 2022 | Approved |
Notes:
Condition of water at Boggy Creek is much better than at Dorey St, and much better that the condition last month. Little smell, water clear, no scum on surface |
||||||||||||||||||||||||||
|
|||||||||||||||||||||||||||||
| #14629 | 25 Apr 2022 | Approved |
Notes:
Several shoals of small mullet near the monitoring site were being chased by larger fish. Two men fishing near the site said that they had caught "good" bream, and released them The water seemed relatively clear, and there was no algae smell. |
||||||||||||||||||||||||||
|
|||||||||||||||||||||||||||||
| #14583 | 5 Apr 2022 | Approved |
Notes:
The low oxygen readings are a concern. The video showing many dead fish was taken in "The Narrows", the area between Boggy Creek and the top of the lake. |
||||||||||||||||||||||||||
|
|||||||||||||||||||||||||||||

All content, files, data and images provided by the EstuaryWatch Data Portal and Gallery are subject to a Creative Commons Attribution License
Content is made available to be used in any way, and should always attribute EstuaryWatch and www.estuarywatch.org.au