EstuaryWatch Data Portal
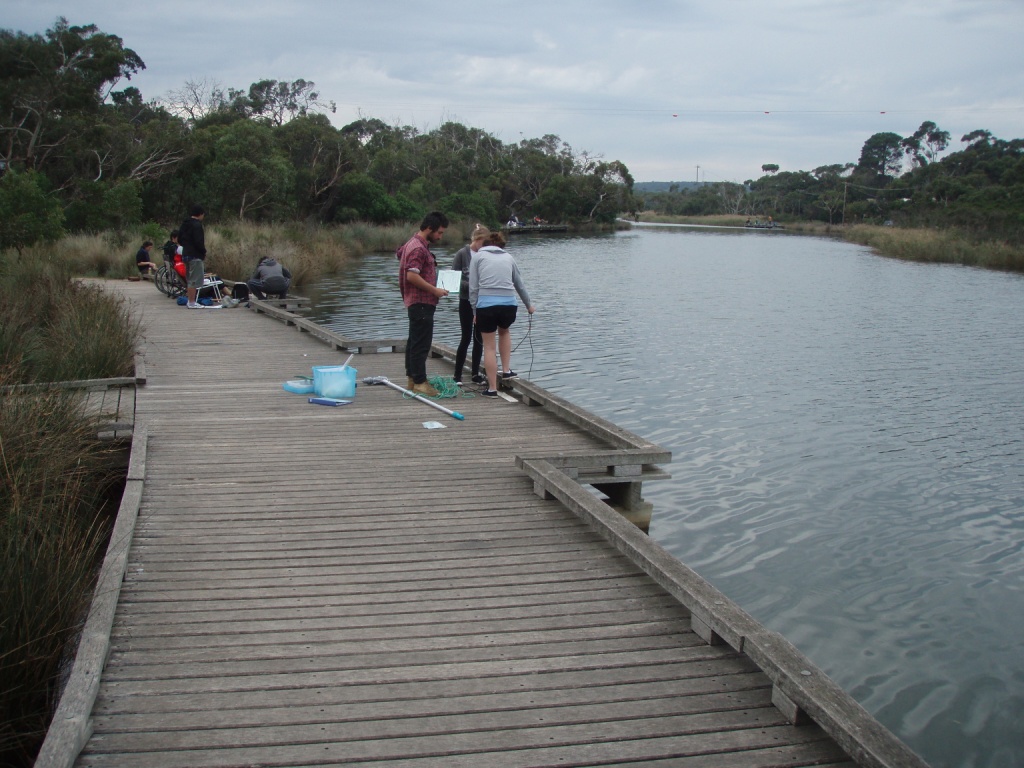
A2 Fishing platform upstream of Great Ocean Rd Bridge
Site details
Overview
| Estuary | Anglesea River Estuary |
|---|---|
| CMA | Corangamite CMA |
| Type | Physico-Chemical |
| Site code | A2 |
| Site name | Fishing platform upstream of Great Ocean Rd Bridge |
| Nearest road and town | Great Ocean Road, Anglesea |
| Description | Fishing Platform upstream of the Great Ocean Road bridge and boat houses located on the western bank. |
| Site access | Park in carpark located adjacent to the boat houses and head upstream. |
| Land use |
|
| Land use description | Recreational reserve located inbetween road and estuary. |
| Status | Active |
| Observation history | 29-04-2007 - 17-04-2024 |
Anglesea Phys/Chem Monitoring Site Two |
|
Observations
Turbidity tubes do not measure below 9 NTU; Chart values of 9 should be interpreted as < 9 NTU
Observations
| Date | 17-05-2023 | 21-06-2023 | 16-08-2023 | 20-09-2023 | 18-10-2023 | 15-11-2023 | 12-12-2023 | 17-01-2024 | 21-02-2024 | 20-03-2024 | 17-04-2024 |
|---|---|---|---|---|---|---|---|---|---|---|---|
| Observation | #15539 | #15597 | #15703 | #15767 | #15809 | #15862 | #15906 | #15977 | #16029 | #16081 | #16133 |
Observation summaries
Turbidity NTU
| 17-05-2023 | 21-06-2023 | 16-08-2023 | 20-09-2023 | 18-10-2023 | 15-11-2023 | 12-12-2023 | 17-01-2024 | 21-02-2024 | 20-03-2024 | 17-04-2024 | |
|---|---|---|---|---|---|---|---|---|---|---|---|
| Top | 9.0 | 9.0 | 9.0 | 9.0 | 9.0 | 9.0 | 9.0 | 24.0 | 9.0 | 9.0 | 9.0 |
| Bottom | 9.0 | 9.0 | 9.0 | 9.0 | 9.0 | 9.0 |
pH
| 17-05-2023 | 21-06-2023 | 16-08-2023 | 20-09-2023 | 18-10-2023 | 15-11-2023 | 12-12-2023 | 17-01-2024 | 21-02-2024 | 20-03-2024 | 17-04-2024 | |
|---|---|---|---|---|---|---|---|---|---|---|---|
| Top | 7.8 | 7.1 | 6.4 | 6.5 | 7.1 | 7.3 | 7.1 | 7.2 | 7.4 | 7.0 | |
| Bottom | 7.9 | 6.7 | 6.5 | 6.5 | 7.1 | 7.2 |
Ammonia mg/L
| 17-05-2023 | 21-06-2023 | 16-08-2023 | 20-09-2023 | 18-10-2023 | 15-11-2023 | 12-12-2023 | 17-01-2024 | 21-02-2024 | 20-03-2024 | 17-04-2024 | |
|---|---|---|---|---|---|---|---|---|---|---|---|
| Top | |||||||||||
| Bottom |
Enterococci orgs/100mL
| 17-05-2023 | 21-06-2023 | 16-08-2023 | 20-09-2023 | 18-10-2023 | 15-11-2023 | 12-12-2023 | 17-01-2024 | 21-02-2024 | 20-03-2024 | 17-04-2024 | |
|---|---|---|---|---|---|---|---|---|---|---|---|
| Top | |||||||||||
| Bottom |
Temperature ° C
| 17-05-2023 | 21-06-2023 | 16-08-2023 | 20-09-2023 | 12-12-2023 | 17-01-2024 | 17-04-2024 | |
|---|---|---|---|---|---|---|---|
| Top | 12.00 | 6.80 | 9.90 | 16.30 | 19.10 | 24.20 | 15.20 |
| Bottom | 12.10 | 10.40 | 10.00 | 16.00 | 19.00 | 24.50 | 15.30 |
Salinity ppt
| 17-05-2023 | 21-06-2023 | 16-08-2023 | 20-09-2023 | 12-12-2023 | 17-01-2024 | 17-04-2024 | |
|---|---|---|---|---|---|---|---|
| Top | |||||||
| Bottom |
D.O. mg/L
| 17-05-2023 | 21-06-2023 | 16-08-2023 | 20-09-2023 | 12-12-2023 | 17-01-2024 | 17-04-2024 | |
|---|---|---|---|---|---|---|---|
| Top | 8.70 | 10.08 | 8.95 | 7.05 | 6.62 | 5.89 | 9.23 |
| Bottom | 8.81 | 5.65 | 8.79 | 7.10 | 6.52 | 5.56 | 8.74 |
D.O. % Sat
| 17-05-2023 | 21-06-2023 | 16-08-2023 | 20-09-2023 | 12-12-2023 | 17-01-2024 | 17-04-2024 | |
|---|---|---|---|---|---|---|---|
| Top | 92.30 | 92.50 | 96.20 | 85.80 | 82.50 | 75.50 | 99.60 |
| Bottom | 93.00 | 55.80 | 95.00 | 85.70 | 80.90 | 75.00 | 99.70 |
Conductivity mS/cm
| 17-05-2023 | 21-06-2023 | 16-08-2023 | 20-09-2023 | 12-12-2023 | 17-01-2024 | 17-04-2024 | |
|---|---|---|---|---|---|---|---|
| Top | 33.11 | 25.40 | 47.70 | 44.51 | 37.29 | 19.28 | 22.87 |
| Bottom | 33.13 | 23.81 | 47.32 | 44.78 | 37.41 | 29.90 | 35.08 |

All content, files, data and images provided by the EstuaryWatch Data Portal and Gallery are subject to a Creative Commons Attribution License
Content is made available to be used in any way, and should always attribute EstuaryWatch and www.estuarywatch.org.au