EstuaryWatch Data Portal
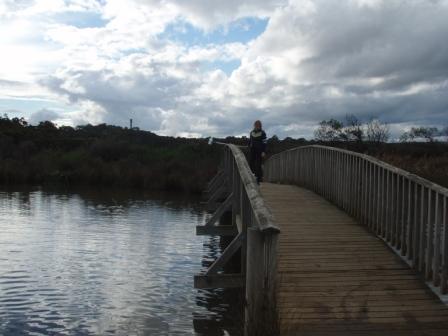
A4 Footbridge adjacent to Coogarah Park
Site details
Overview
| Estuary | Anglesea River Estuary |
|---|---|
| CMA | Corangamite CMA |
| Type | Physico-Chemical |
| Site code | A4 |
| Site name | Footbridge adjacent to Coogarah Park |
| Nearest road and town | Anglesea |
| Description | Footbridge located adjacent to Coogarah Park. |
| Site access | Head east along the footpath located adjacent to the Coogarah Park Carpark. |
| Land use |
|
| Land use description | This site is surrounded by native bushland that is broken up by gravel walking paths. |
| Status | Active |
| Observation history | 29-04-2007 - 17-04-2024 |
A4 phys/chem monitoring site |
|
Observations
Turbidity tubes do not measure below 9 NTU; Chart values of 9 should be interpreted as < 9 NTU
Observations
| Date | 17-05-2023 | 21-06-2023 | 16-08-2023 | 20-09-2023 | 18-10-2023 | 15-11-2023 | 12-12-2023 | 17-01-2024 | 21-02-2024 | 20-03-2024 | 17-04-2024 |
|---|---|---|---|---|---|---|---|---|---|---|---|
| Observation | #15541 | #15601 | #15705 | #15769 | #15811 | #15864 | #15908 | #15979 | #16031 | #16080 | #16135 |
Observation summaries
Turbidity NTU
| 17-05-2023 | 21-06-2023 | 16-08-2023 | 20-09-2023 | 18-10-2023 | 15-11-2023 | 12-12-2023 | 17-01-2024 | 21-02-2024 | 20-03-2024 | 17-04-2024 | |
|---|---|---|---|---|---|---|---|---|---|---|---|
| Top | 9.0 | 9.0 | 10.0 | 9.0 | 9.0 | 9.0 | 9.0 | 9.0 | 9.0 | 9.0 | 9.0 |
| Bottom | 9.0 | 9.0 | 10.0 | 9.0 | 9.0 | 9.0 | 9.0 | 9.0 | 9.0 | 9.0 | 9.0 |
pH
| 17-05-2023 | 21-06-2023 | 16-08-2023 | 20-09-2023 | 18-10-2023 | 15-11-2023 | 12-12-2023 | 17-01-2024 | 21-02-2024 | 20-03-2024 | 17-04-2024 | |
|---|---|---|---|---|---|---|---|---|---|---|---|
| Top | 7.5 | 7.0 | 3.6 | 6.3 | 7.1 | 7.2 | 7.3 | 7.3 | 7.3 | 6.9 | |
| Bottom | 7.8 | 7.0 | 4.0 | 6.3 | 7.1 | 7.1 | 7.3 | 7.1 | 7.2 | 6.6 |
Ammonia mg/L
| 17-05-2023 | 21-06-2023 | 16-08-2023 | 20-09-2023 | 18-10-2023 | 15-11-2023 | 12-12-2023 | 17-01-2024 | 21-02-2024 | 20-03-2024 | 17-04-2024 | |
|---|---|---|---|---|---|---|---|---|---|---|---|
| Top | |||||||||||
| Bottom |
Enterococci orgs/100mL
| 17-05-2023 | 21-06-2023 | 16-08-2023 | 20-09-2023 | 18-10-2023 | 15-11-2023 | 12-12-2023 | 17-01-2024 | 21-02-2024 | 20-03-2024 | 17-04-2024 | |
|---|---|---|---|---|---|---|---|---|---|---|---|
| Top | |||||||||||
| Bottom |
Temperature ° C
| 17-05-2023 | 21-06-2023 | 16-08-2023 | 20-09-2023 | 18-10-2023 | 15-11-2023 | 12-12-2023 | 17-01-2024 | 21-02-2024 | 20-03-2024 | 17-04-2024 | |
|---|---|---|---|---|---|---|---|---|---|---|---|
| Top | 11.80 | 9.10 | 10.40 | 16.00 | 16.00 | 18.10 | 19.70 | 24.00 | 21.90 | 19.10 | 15.20 |
| Bottom | 12.50 | 11.20 | 10.90 | 16.40 | 15.50 | 18.10 | 19.20 | 24.80 | 21.50 | 19.50 | 15.30 |
Salinity ppt
| 17-05-2023 | 21-06-2023 | 16-08-2023 | 20-09-2023 | 18-10-2023 | 15-11-2023 | 12-12-2023 | 17-01-2024 | 21-02-2024 | 20-03-2024 | 17-04-2024 | |
|---|---|---|---|---|---|---|---|---|---|---|---|
| Top | |||||||||||
| Bottom |
D.O. mg/L
| 17-05-2023 | 21-06-2023 | 16-08-2023 | 20-09-2023 | 18-10-2023 | 15-11-2023 | 12-12-2023 | 17-01-2024 | 21-02-2024 | 20-03-2024 | 17-04-2024 | |
|---|---|---|---|---|---|---|---|---|---|---|---|
| Top | 8.99 | 9.85 | 9.44 | 8.30 | 7.74 | 5.99 | 6.72 | 5.75 | 5.14 | 6.51 | 8.32 |
| Bottom | 8.74 | 9.78 | 9.10 | 8.24 | 7.81 | 5.88 | 6.98 | 4.47 | 4.89 | 6.31 | 8.22 |
D.O. % Sat
| 17-05-2023 | 21-06-2023 | 16-08-2023 | 20-09-2023 | 18-10-2023 | 15-11-2023 | 12-12-2023 | 17-01-2024 | 21-02-2024 | 20-03-2024 | 17-04-2024 | |
|---|---|---|---|---|---|---|---|---|---|---|---|
| Top | 94.30 | 95.60 | 101.30 | 101.10 | 92.70 | 75.50 | 84.80 | 74.60 | 67.30 | 82.00 | 95.10 |
| Bottom | 93.50 | 99.70 | 99.90 | 99.90 | 92.40 | 74.00 | 86.90 | 61.20 | 63.70 | 79.20 | 94.10 |
Conductivity mS/cm
| 17-05-2023 | 21-06-2023 | 16-08-2023 | 20-09-2023 | 18-10-2023 | 15-11-2023 | 12-12-2023 | 17-01-2024 | 21-02-2024 | 20-03-2024 | 17-04-2024 | |
|---|---|---|---|---|---|---|---|---|---|---|---|
| Top | 33.05 | 26.55 | 44.87 | 43.55 | 42.60 | 44.13 | 37.41 | 24.54 | 37.36 | 37.34 | 35.23 |
| Bottom | 32.43 | 28.59 | 47.20 | 43.67 | 42.50 | 44.20 | 37.38 | 35.29 | 37.51 | 37.42 | 35.33 |

All content, files, data and images provided by the EstuaryWatch Data Portal and Gallery are subject to a Creative Commons Attribution License
Content is made available to be used in any way, and should always attribute EstuaryWatch and www.estuarywatch.org.au